Spend benchmarks
The Spend benchmarks page provides a detailed aggregated view of your total spend on ocean freight across individual trade lanes, corridors, or suppliers based on your volume and rate data available in Xeneta.
This allows you to compare your spend to how much the market is paying to ship the same volume of TEUs on the same trade lanes or corridors.
The page provides multiple options and filters that allow you to further categorize and drill down into your spend information.
Available views
The Spend benchmarks page provides three different views for your spend data — All spend, Corridors, Suppliers, and Peers.
Any selected market metrics or filters persist across different tabs. For example, if you select the Short-term and Market average metrics while on the Corridors tab, they will remain the same when you switch to All spend or Suppliers.
All spend
The All spend tab features a more granular view that shows your spend and savings information across all of your individual trade lanes which Xeneta currently has volume information for — with references to their associated supplier, container type, and contract number.
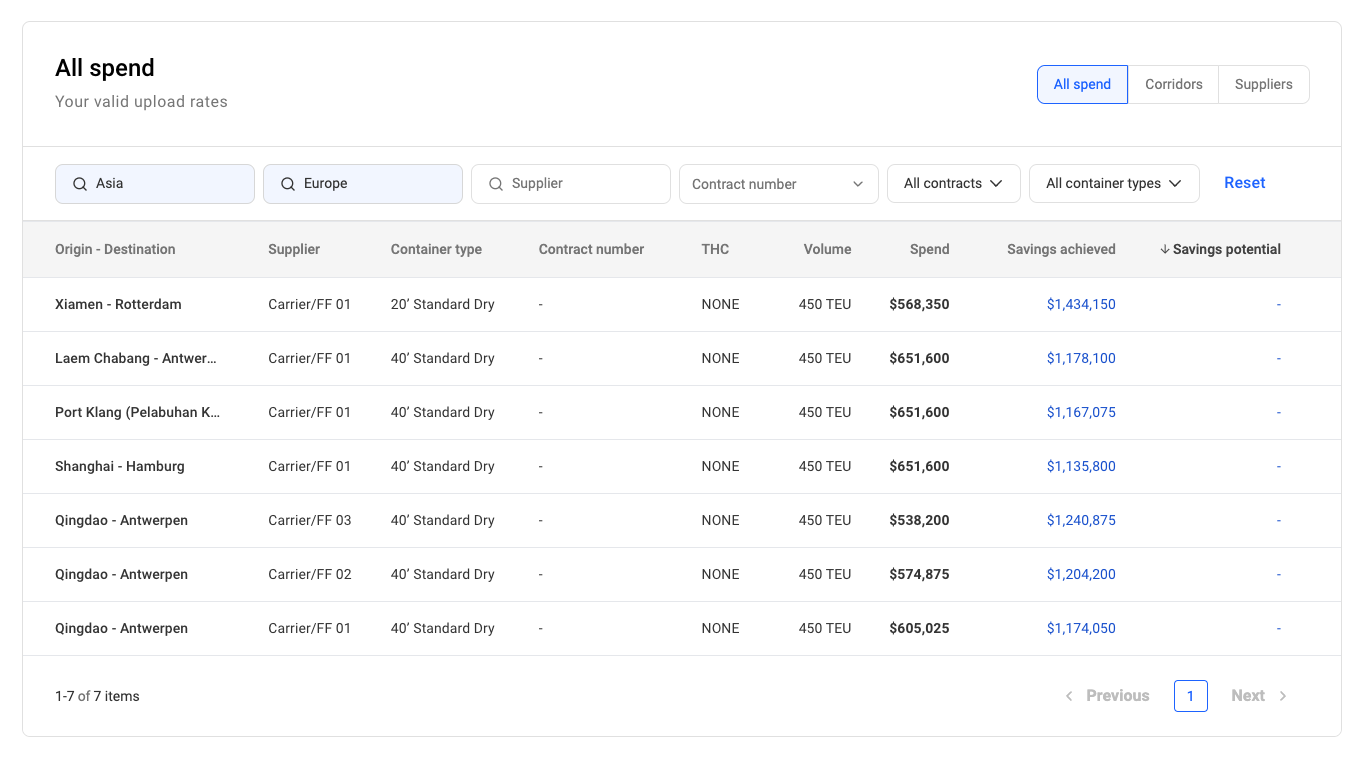
Depending on the amount of your data available in Xeneta, the list of trade lanes may be quite long — be sure to use the available filter options to narrow it down.
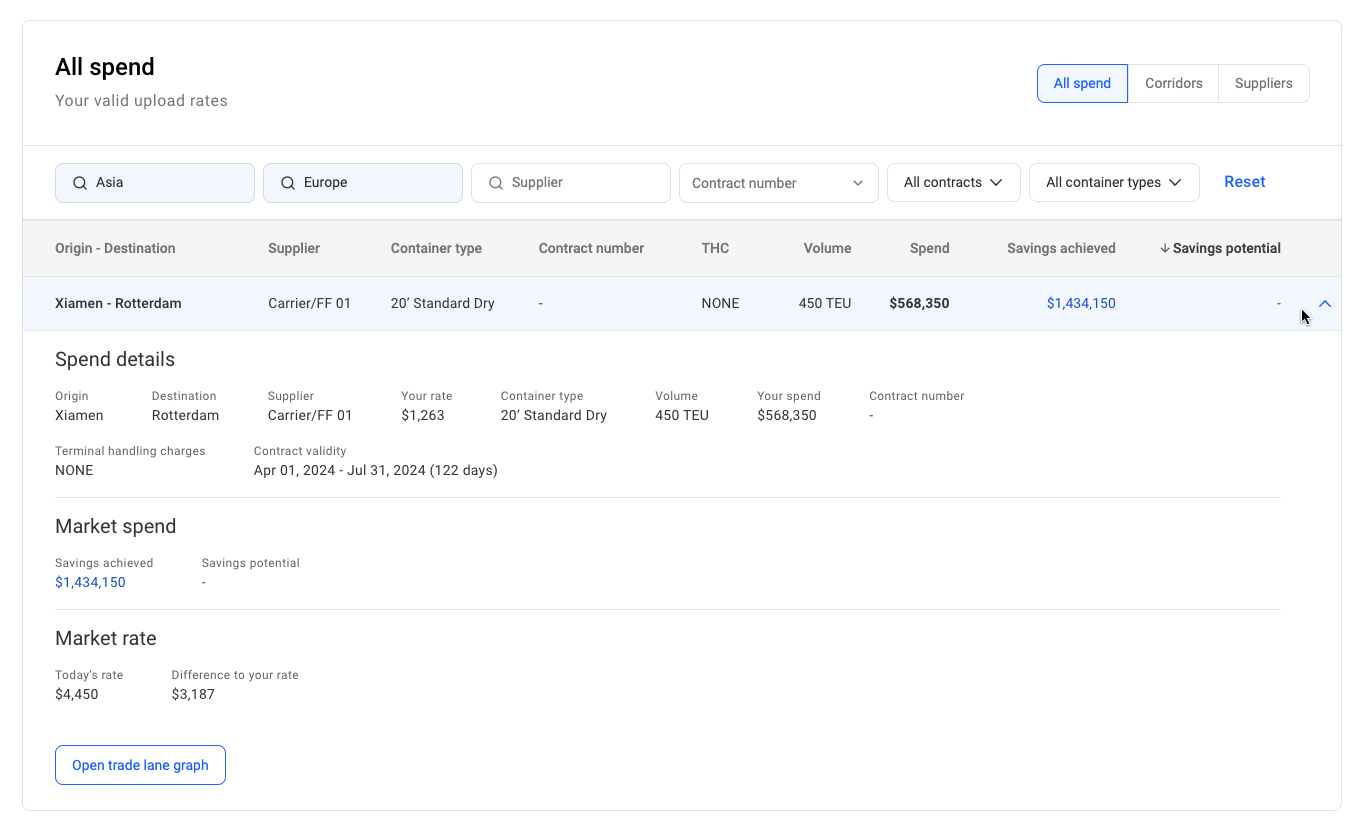
Clicking on an individual trade lane will open an additional panel with all available information on that specific trade lane with an option to view it Market benchmarks:
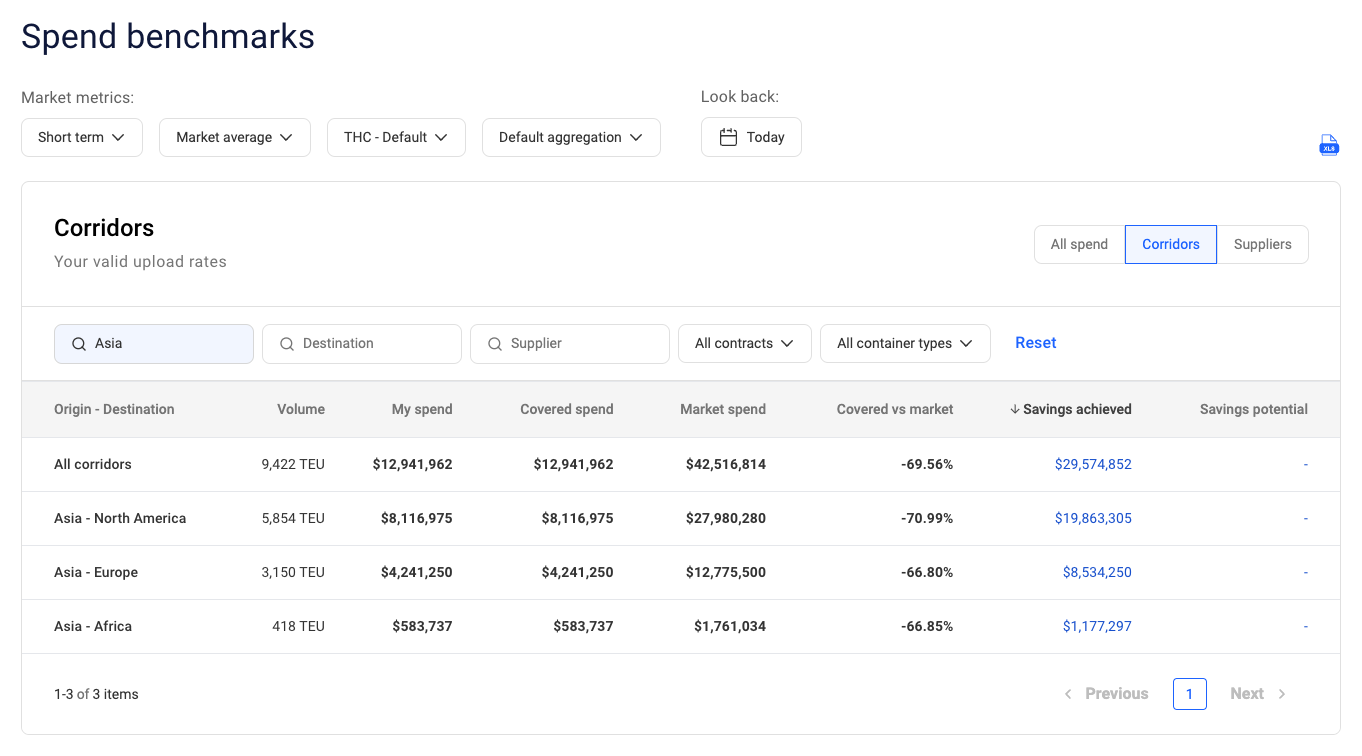
Corridors
The Corridors tab shows your spend grouped by corridor and provides a high-level overview of how you compare to the market as well as how much you could potentially save (or are already saving).
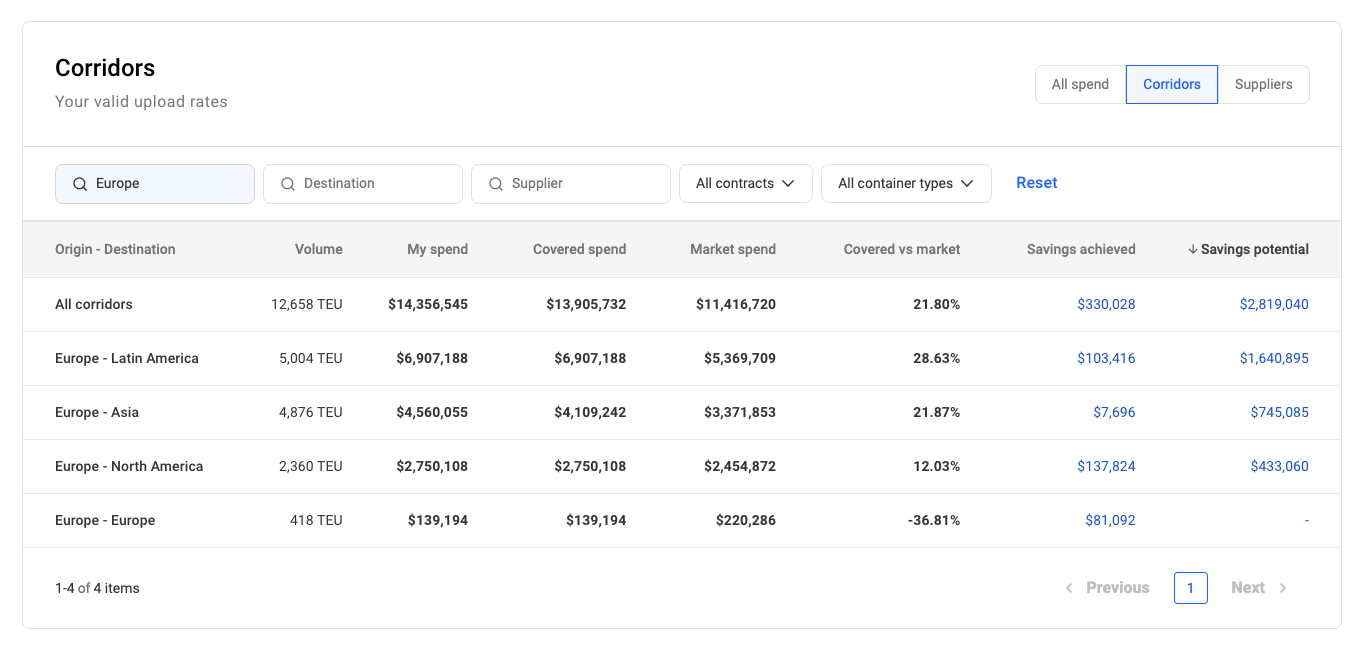
This view gives you a general idea of which of your corridors are performing better than others, and where to look if you want to improve.
Clicking on a specific corridor will take you to the All spend tab and show you a list of all of your trade lanes that belong to that corridor.
Suppliers
The Suppliers tab is similar to Corridors but groups your spend by supplier instead.
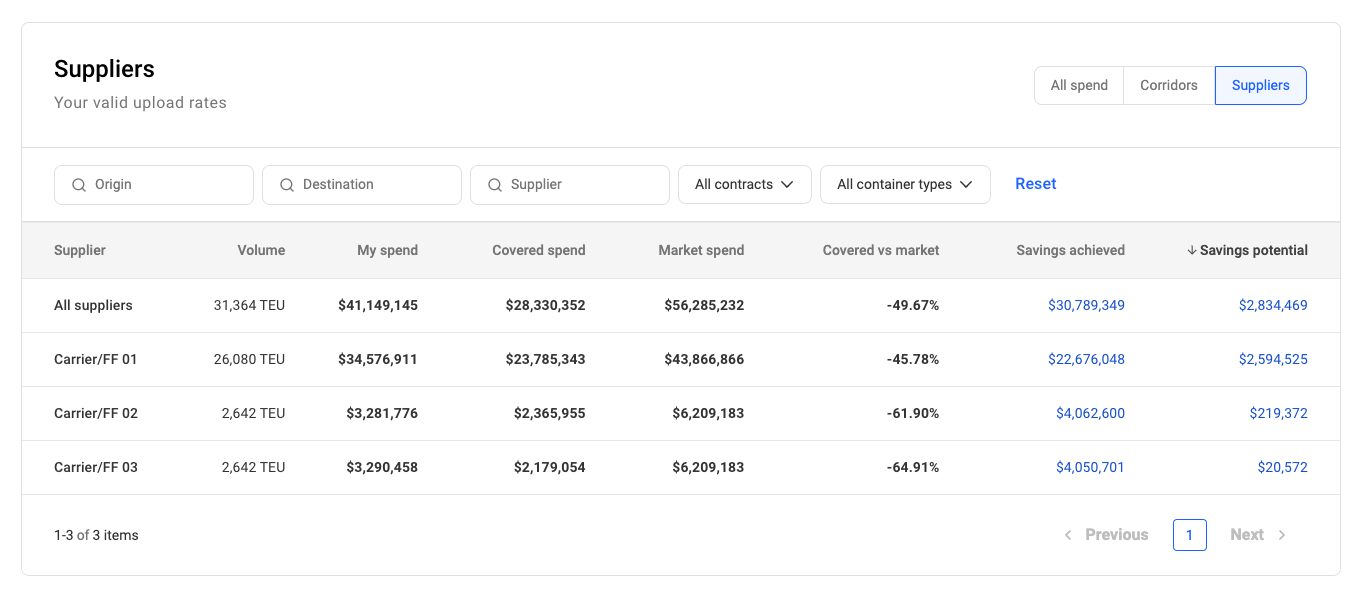
This view is useful if you want to see which of your suppliers are providing rates that are more in line with the market and which you might want to renegotiate in the future.
Clicking on a specific supplier will take you to the All spend tab and show you a list of all of your trade lanes serviced by that supplier.
Peers
The Peers tab shows how your performance in terms of spend compares to other companies within the selected industry across the largest global corridors.
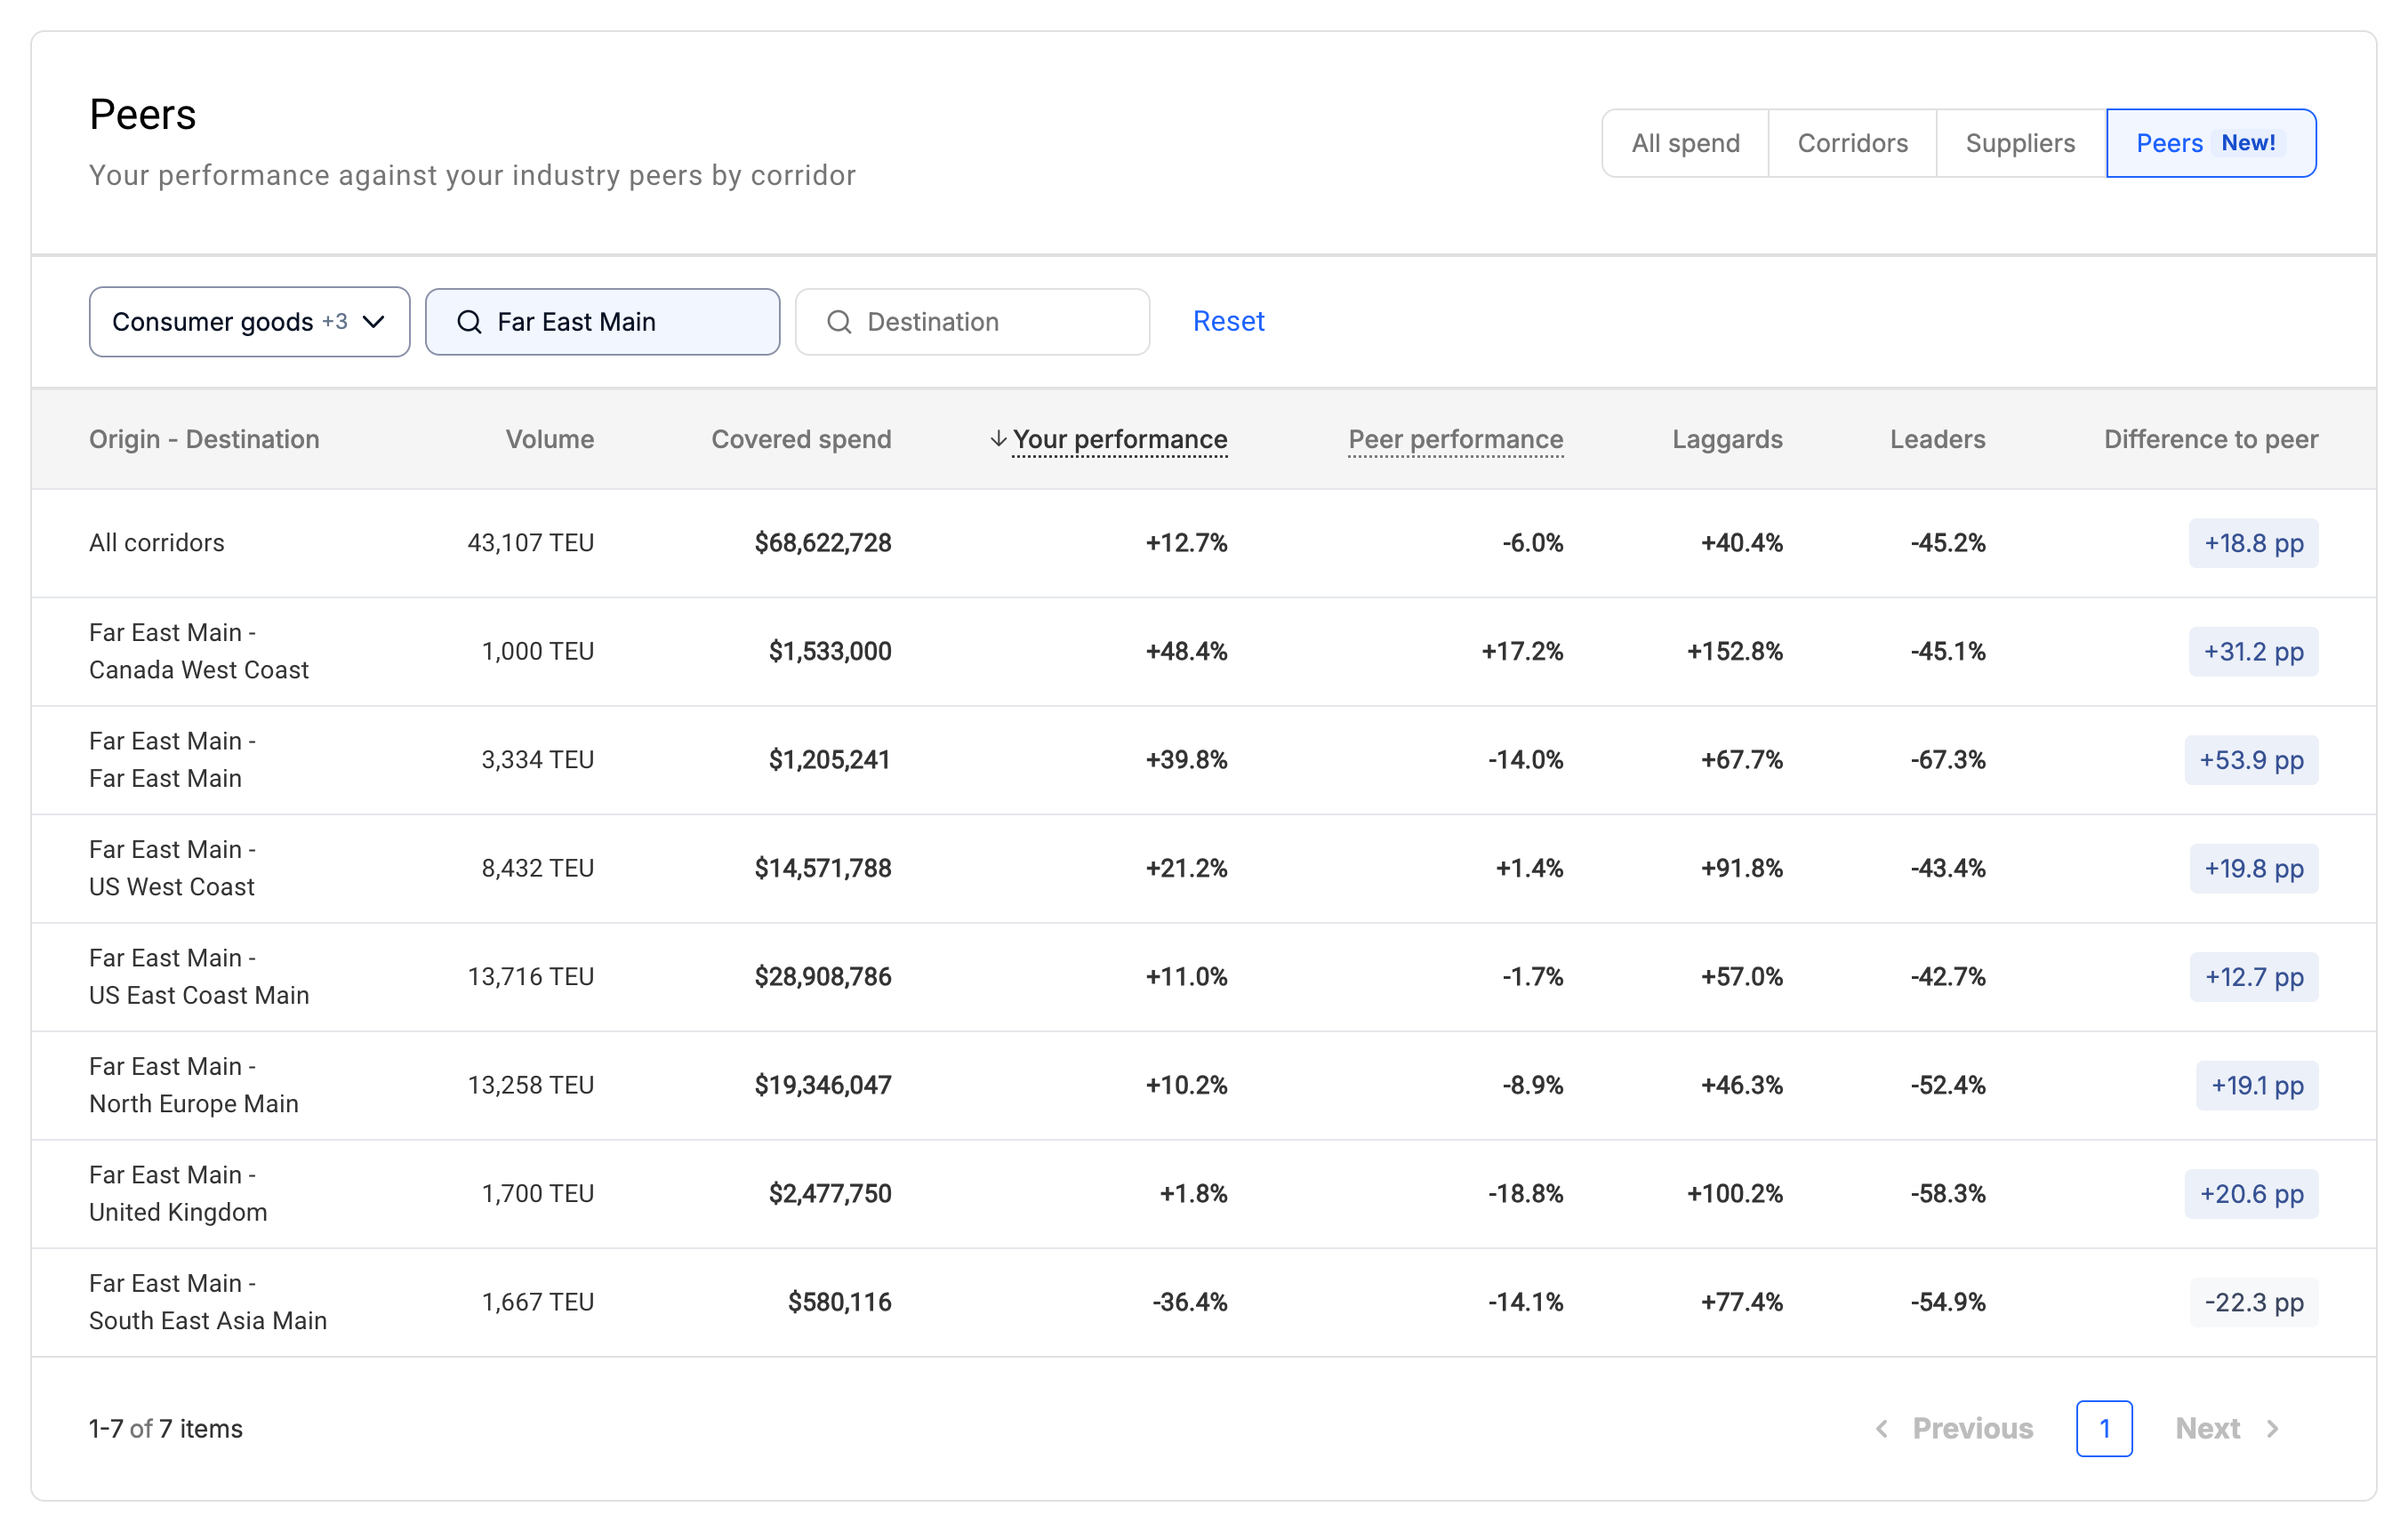
The table shows Your performance relative to the market by spend and compares those indicators with your peers within the selected industry or industry group.
- Peer performance shows how your average peer compares to the market by spend
- Laggards shows the peer with the highest rates compared to the market
- Leaders shows the peer with the lowest rates compared to the market
- Difference to peer shows the difference between Your performance and Peer performance (in percentage points)
Updated 4 months ago