Carrier comparison scorecard
The Carrier Comparison Scorecard in Xeneta helps you evaluate and rank carriers on the factors that matter most to your business. You can evaluate and rank carriers across cost, reliability, capacity, carbon emission index and more. Instead of spreadsheets, you get a data-driven, neutral view to support faster, more confident procurement decisions.
To know about the method of scoring, read the section on Methodology: Scorecard computation
How to create a scorecard
-
Open the Scorecard tool
Go to *Monitor > Carrier Scorecards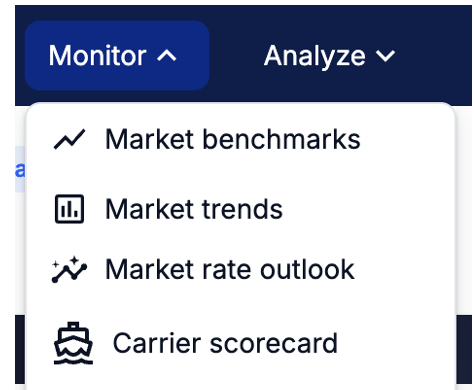
-
Select trade lane(s)
Choose a specific origin/destination pair
-
Choose your metrics
You can select from:- Core metrics: including transit times, schedule reliability, capacity offered, capacity blanked, carbon emissions index (CEI)
- Derived metrics: including difference to market, transit time deviation, cancellation rates
-
Assign weights or importance
Decide how much each metric matters to your business. The platform automatically normalizes values so that a higher score always equals better performance.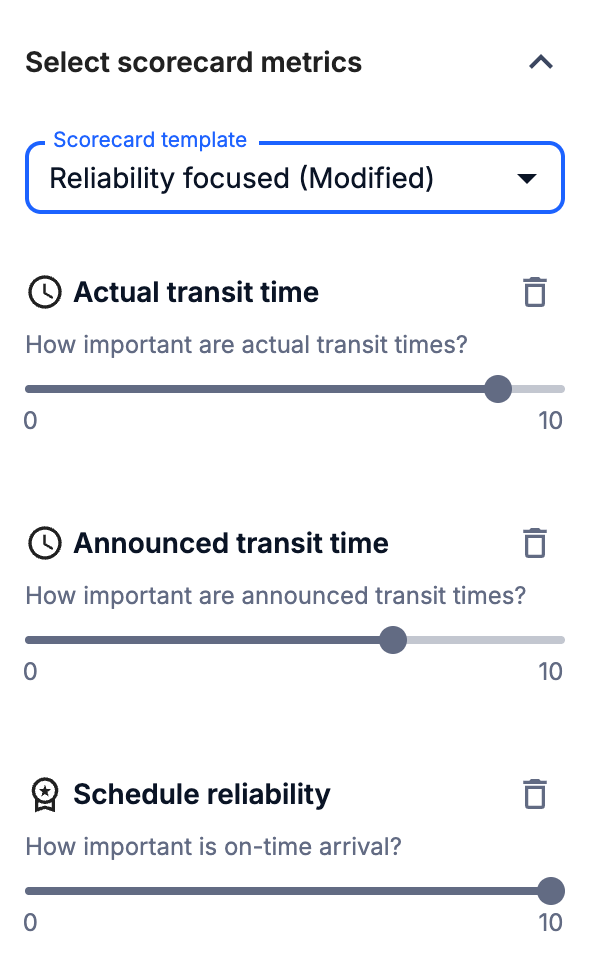
-
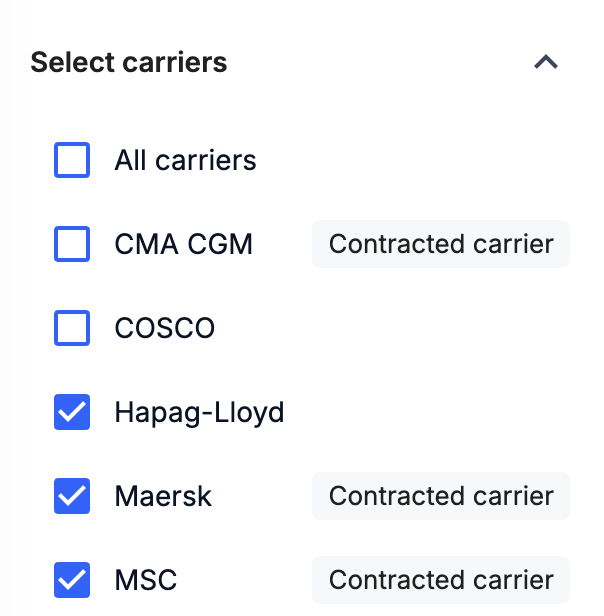
Select carriers
Add carriers you want to compare. Add the incumbent carriers marked as
Contracted carrieror potential new ones. -
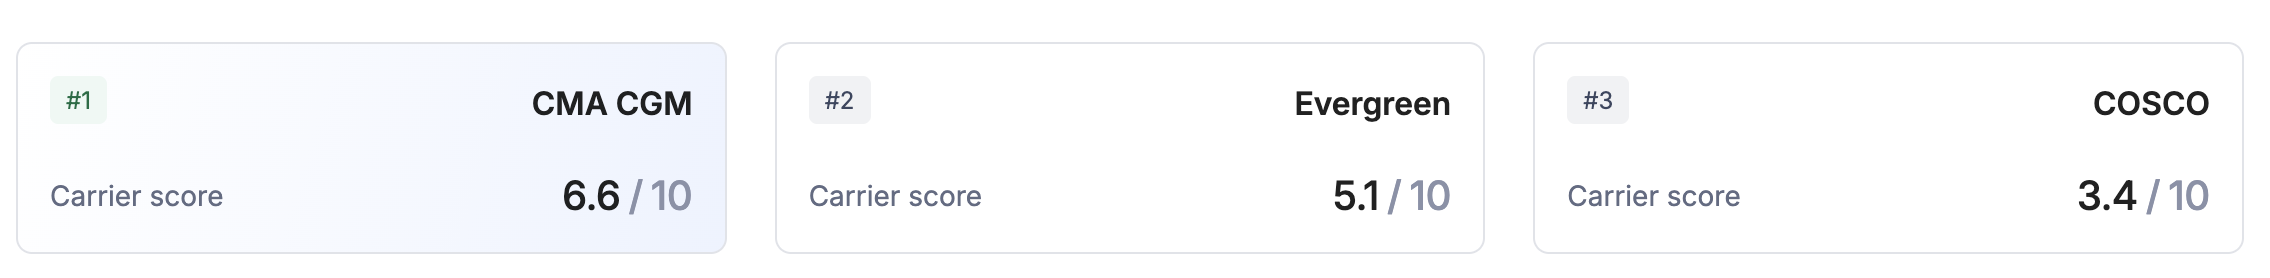
View the results
-
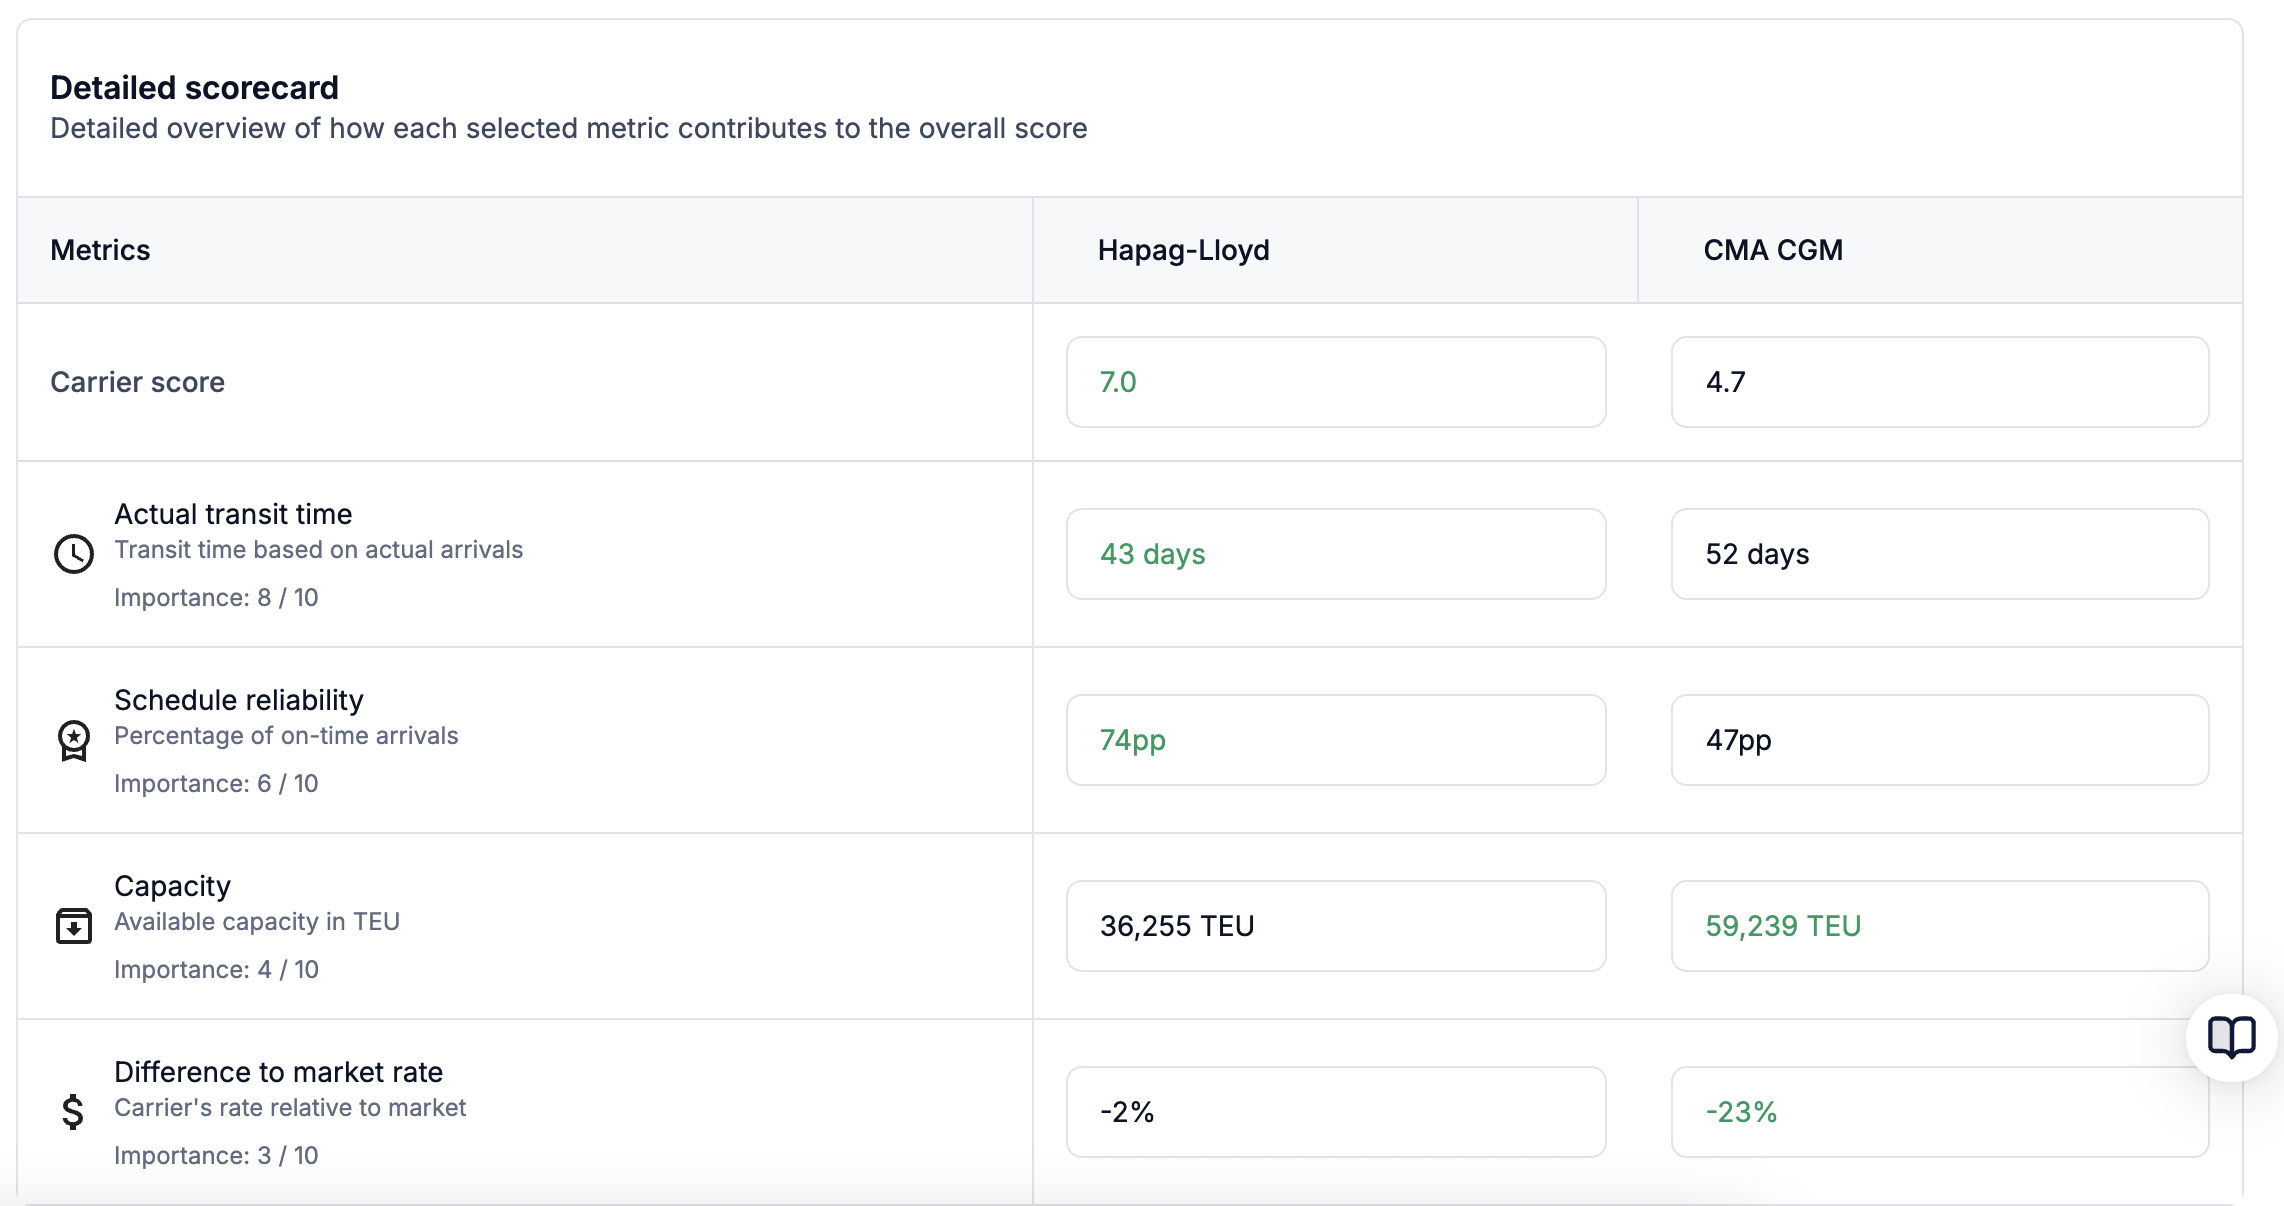
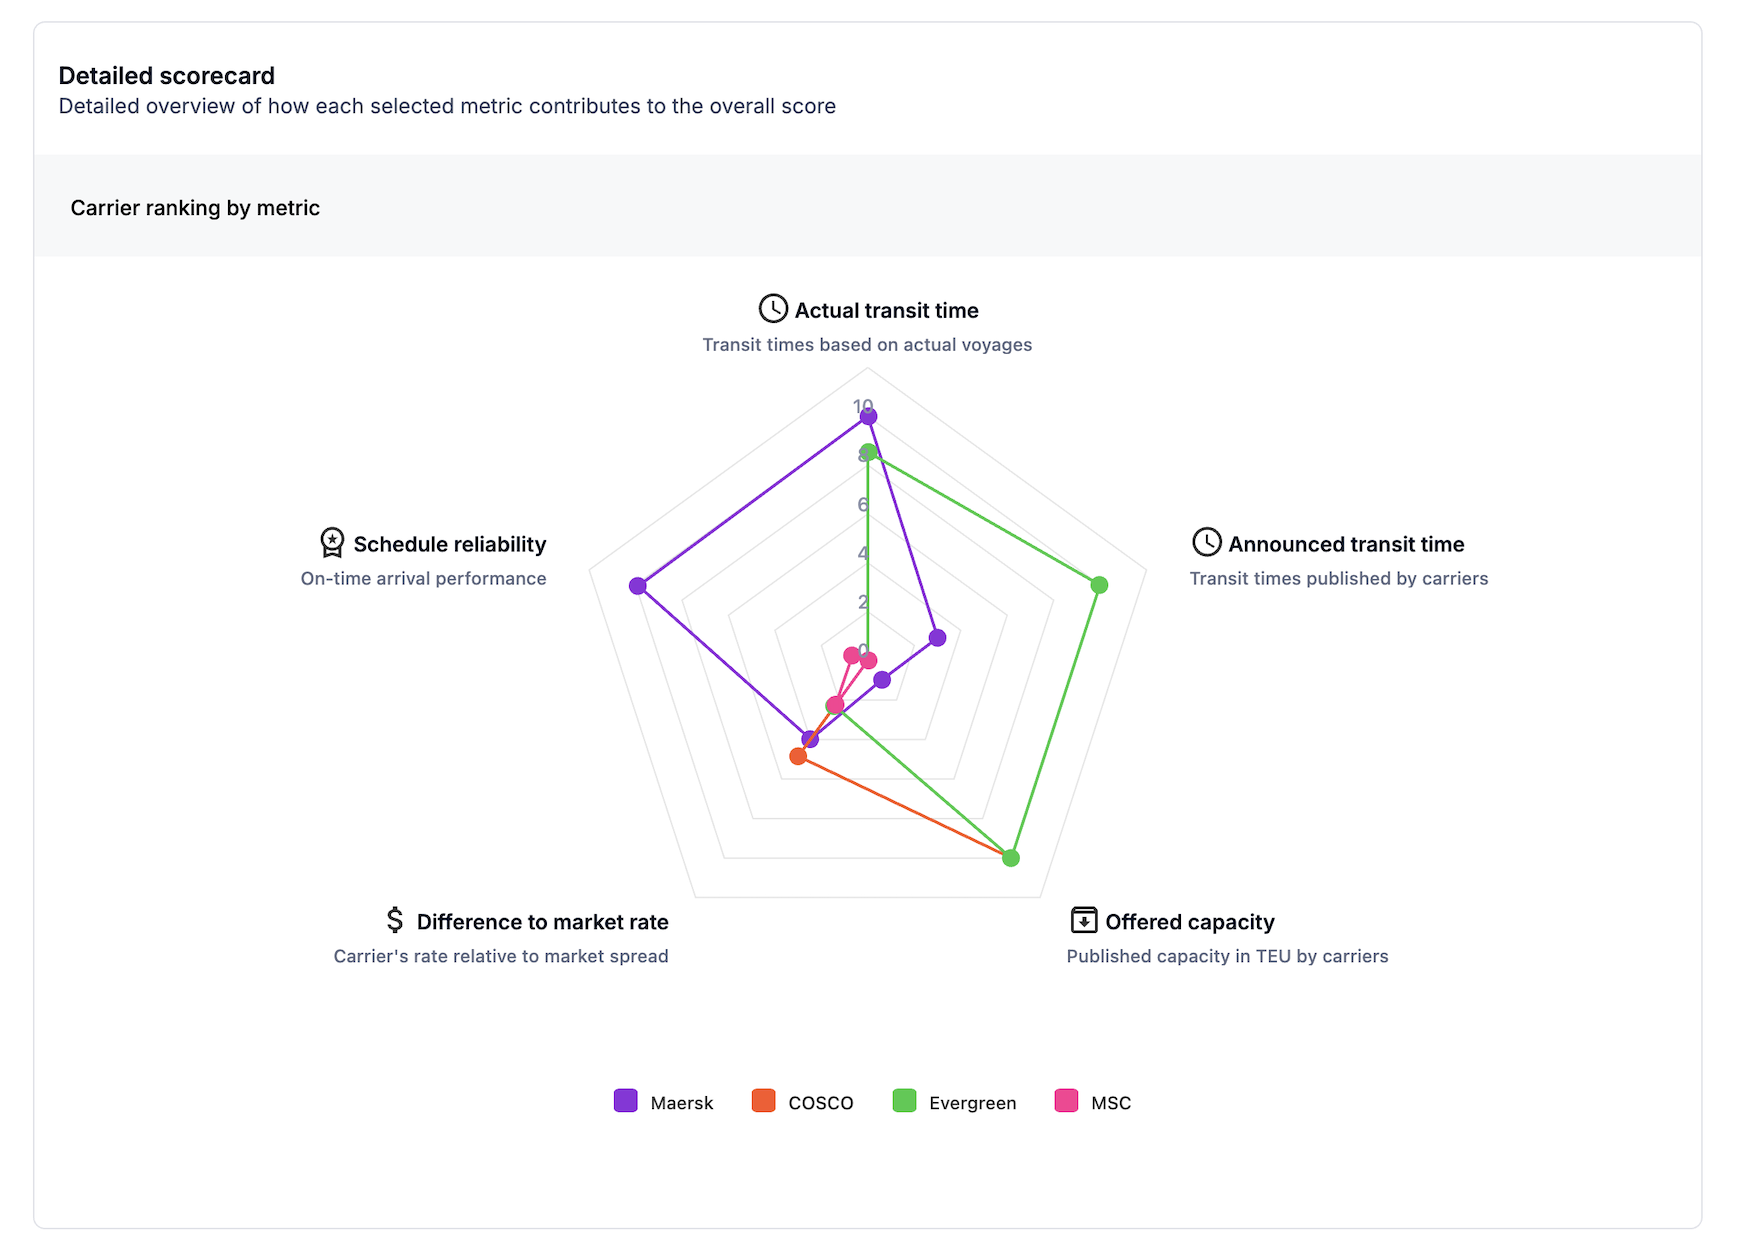
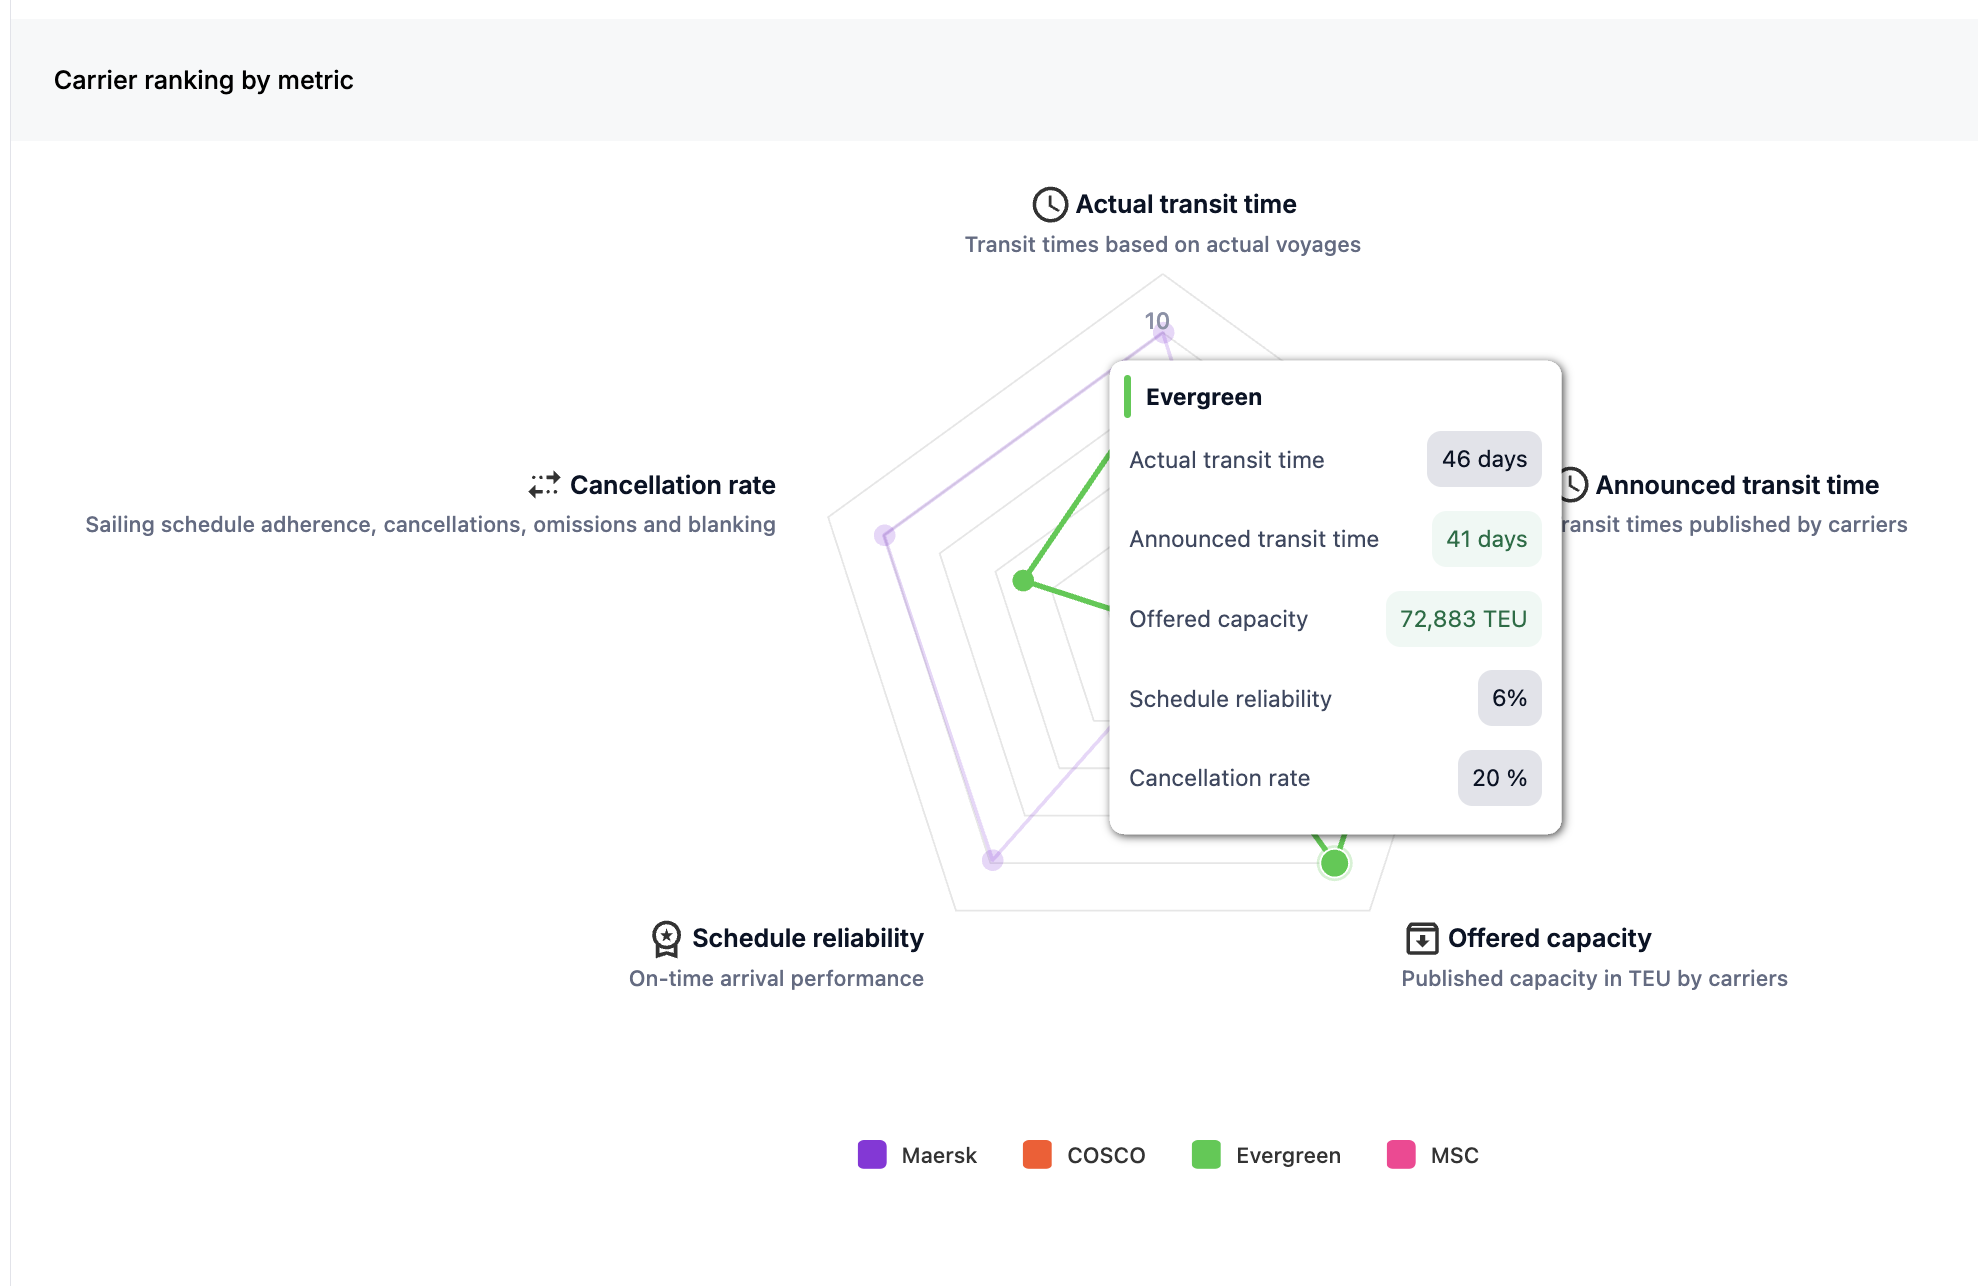
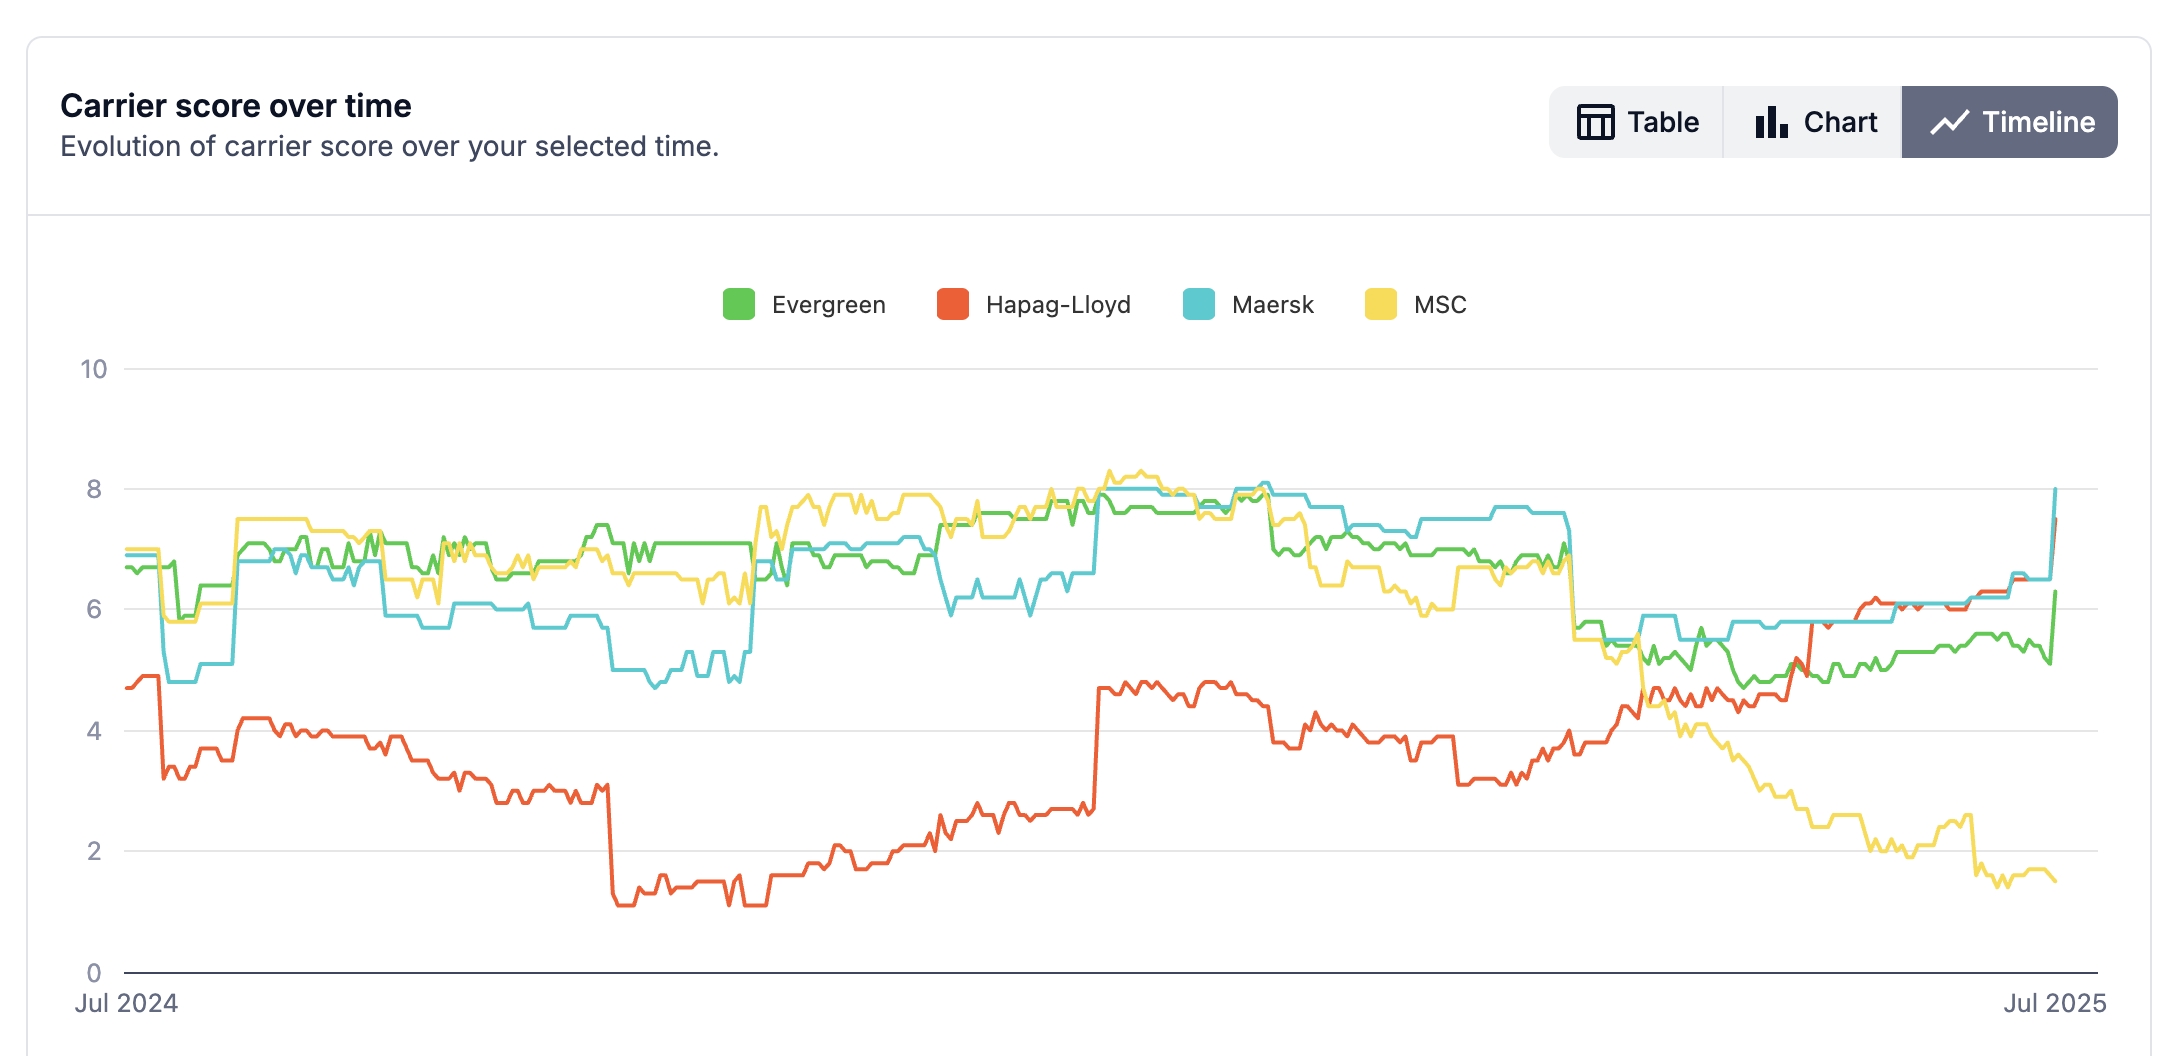
Carriers are scored, ranked and compared next to each other.
-
Rank cards
-
Tabular view
-
Charts view
-
Timeline view
-
-
-
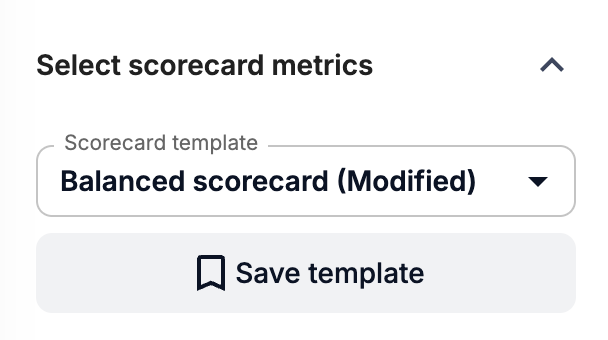
Save, export, or share the scorecard with your team
Save the configuration of your selection of metrics and their weights. Use them across any routes you wish to. Export the scorecard to use in further alignment discussions.

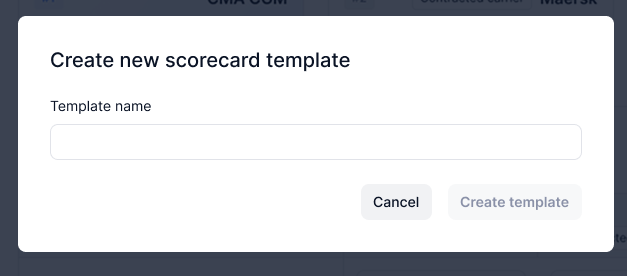
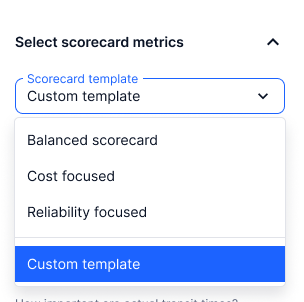
Quick-start with templates
To save time, start from Xeneta’s pre-built templates:
- Cost-focused - Prioritizes rates and hidden cost drivers, while service and sustainability are secondary.
- Reliability-focused - Strong emphasis on on-time delivery and service stability.
- Sustainability-driven - Covers cost, service, capacity, and sustainability equally
Each template can be customized further and saved as your own
 |  |
|---|
Where to find your scorecards
Your saved and recent scorecards appear at the bottom of the Carrier Scorecard page. From here you can:
- Open existing scorecards pre-built and custom templates
- Edit weights or metrics to store as new templates
Methodology: Scorecard computation
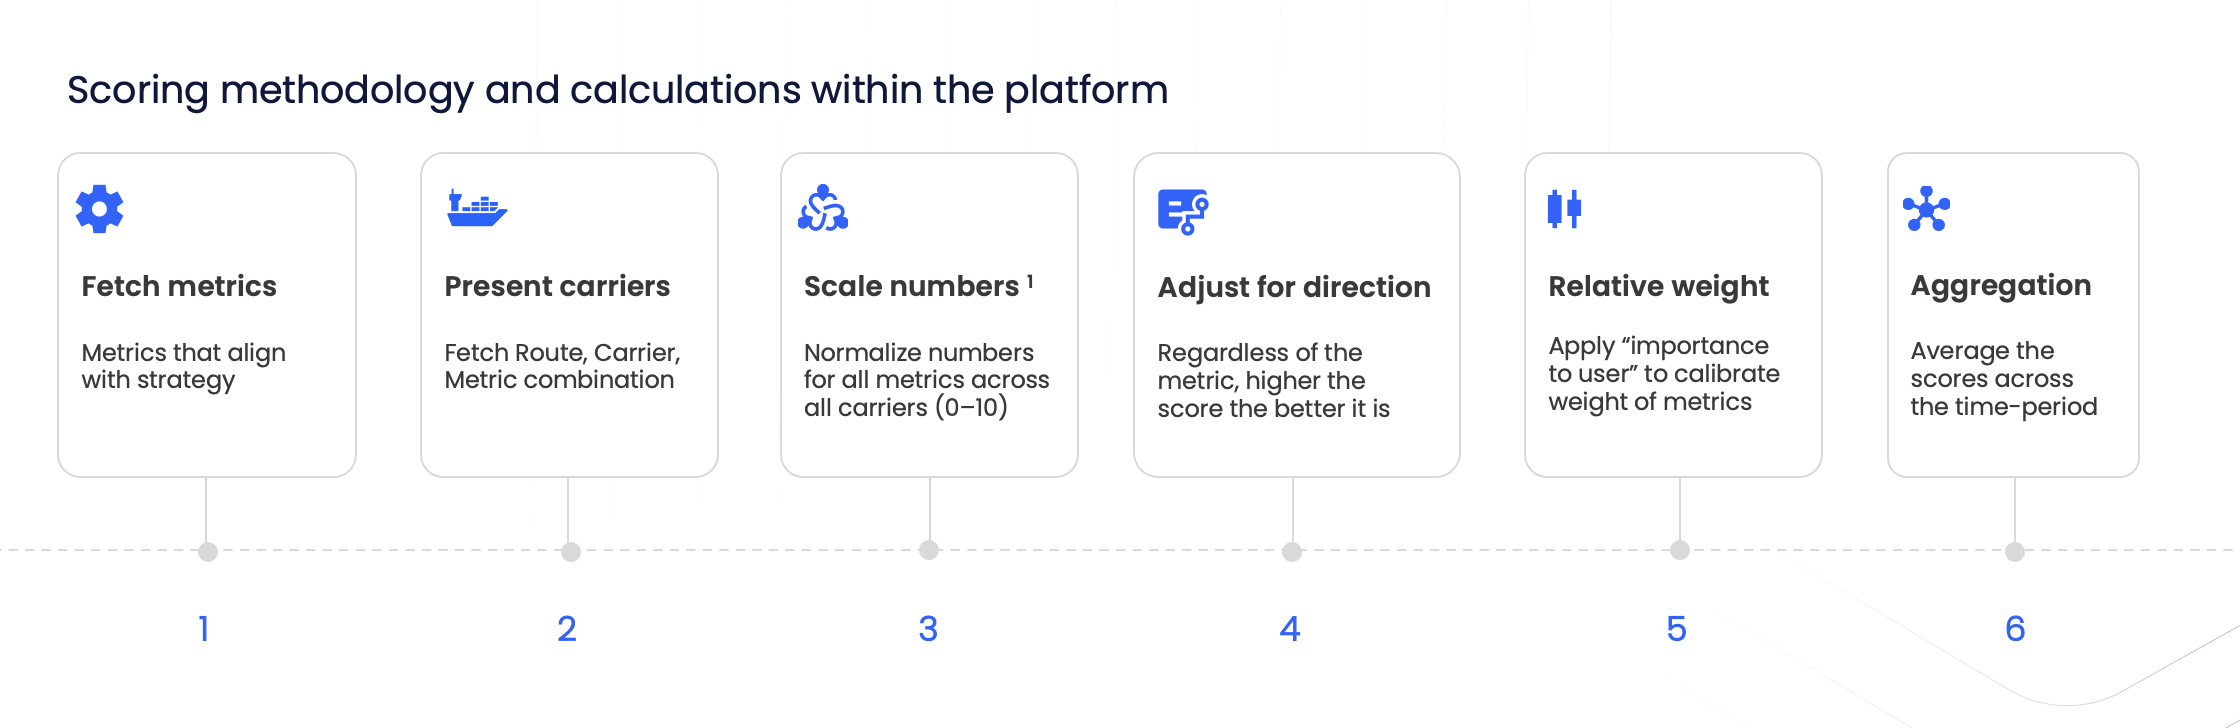
Following is how the scores are computed and carriers are ranked
1. Source of the data
- The data used to compute the scores are the aggregated data present in the platform. For example
- With rates related metrics, the benchmark-rates are used to compute the score.
- For actual transit time, the aggregated data for each carrier is used in the calculations.
- The update interval on each of the dependent datasets are independent of the carrier comparison scorecard. The computed score is based on the data as known in current time.
2. Scoring Each Metric
-
Each metric you add (like schedule reliability, transit time, or difference to market rates) is converted into a score from 0 to 100, but is not visible to the user.
-
A higher score always means “better” performance.
- Example: A carrier with the best reliability gets a score closer to 100.
- For metrics where “lower is better” (e.g., shorter transit time), we adjust the scale so that a high score still means “better.”
3. Normalizing Across Carriers
- Scores are calculated using a scaling method that considers the spread of the scores across all the carriers for each metric added to the scorecard.
- This means we compare each carrier against the range of all available carriers on that lane.
- The top performer in a metric is assigned 10, the lowest 0, and others fall in between.
4. Combining the Metrics
- You decide which metrics are most important for your business by assigning weights in form of importance.
- Example: If cost is more important than reliability, you can give difference to market rates a higher weight.
- The system then calculates a weighted average score (0–100) for each carrier, reflecting your priorities.
5. Time Periods
- If you’re looking at a time period, we will present an average score over the time, so that you can evaluate for consistent and relative carrier performance over time.
Note: For a score to appear, we require that the data for the specific metric should be available for at least 50% of the selected time horizon.
6. Missing Data
-
If a carrier has no data for a metric on your selected lane, the system may:
- Exclude the carrier from that metric, or
- Use the closest available data (e.g., from a nearby lane).
-
This ensures comparisons remain fair and transparent.
The result: Each carrier receives a final score between 0 and 10, making it easy to see how they rank side by side.
✅ Tip: Use the scorecard during tenders, supplier evaluations, or leadership updates to provide neutral benchmarks and speed up decision-making.
Updated 4 months ago