How to use Market Benchmarks (newly updated)
Air Monitor
This quick guide will walk you through our newly updated Market Benchmarks, within Air Monitor, and briefly explain how you can get the most out of this first-of-its-kind unified view of the air freight market.
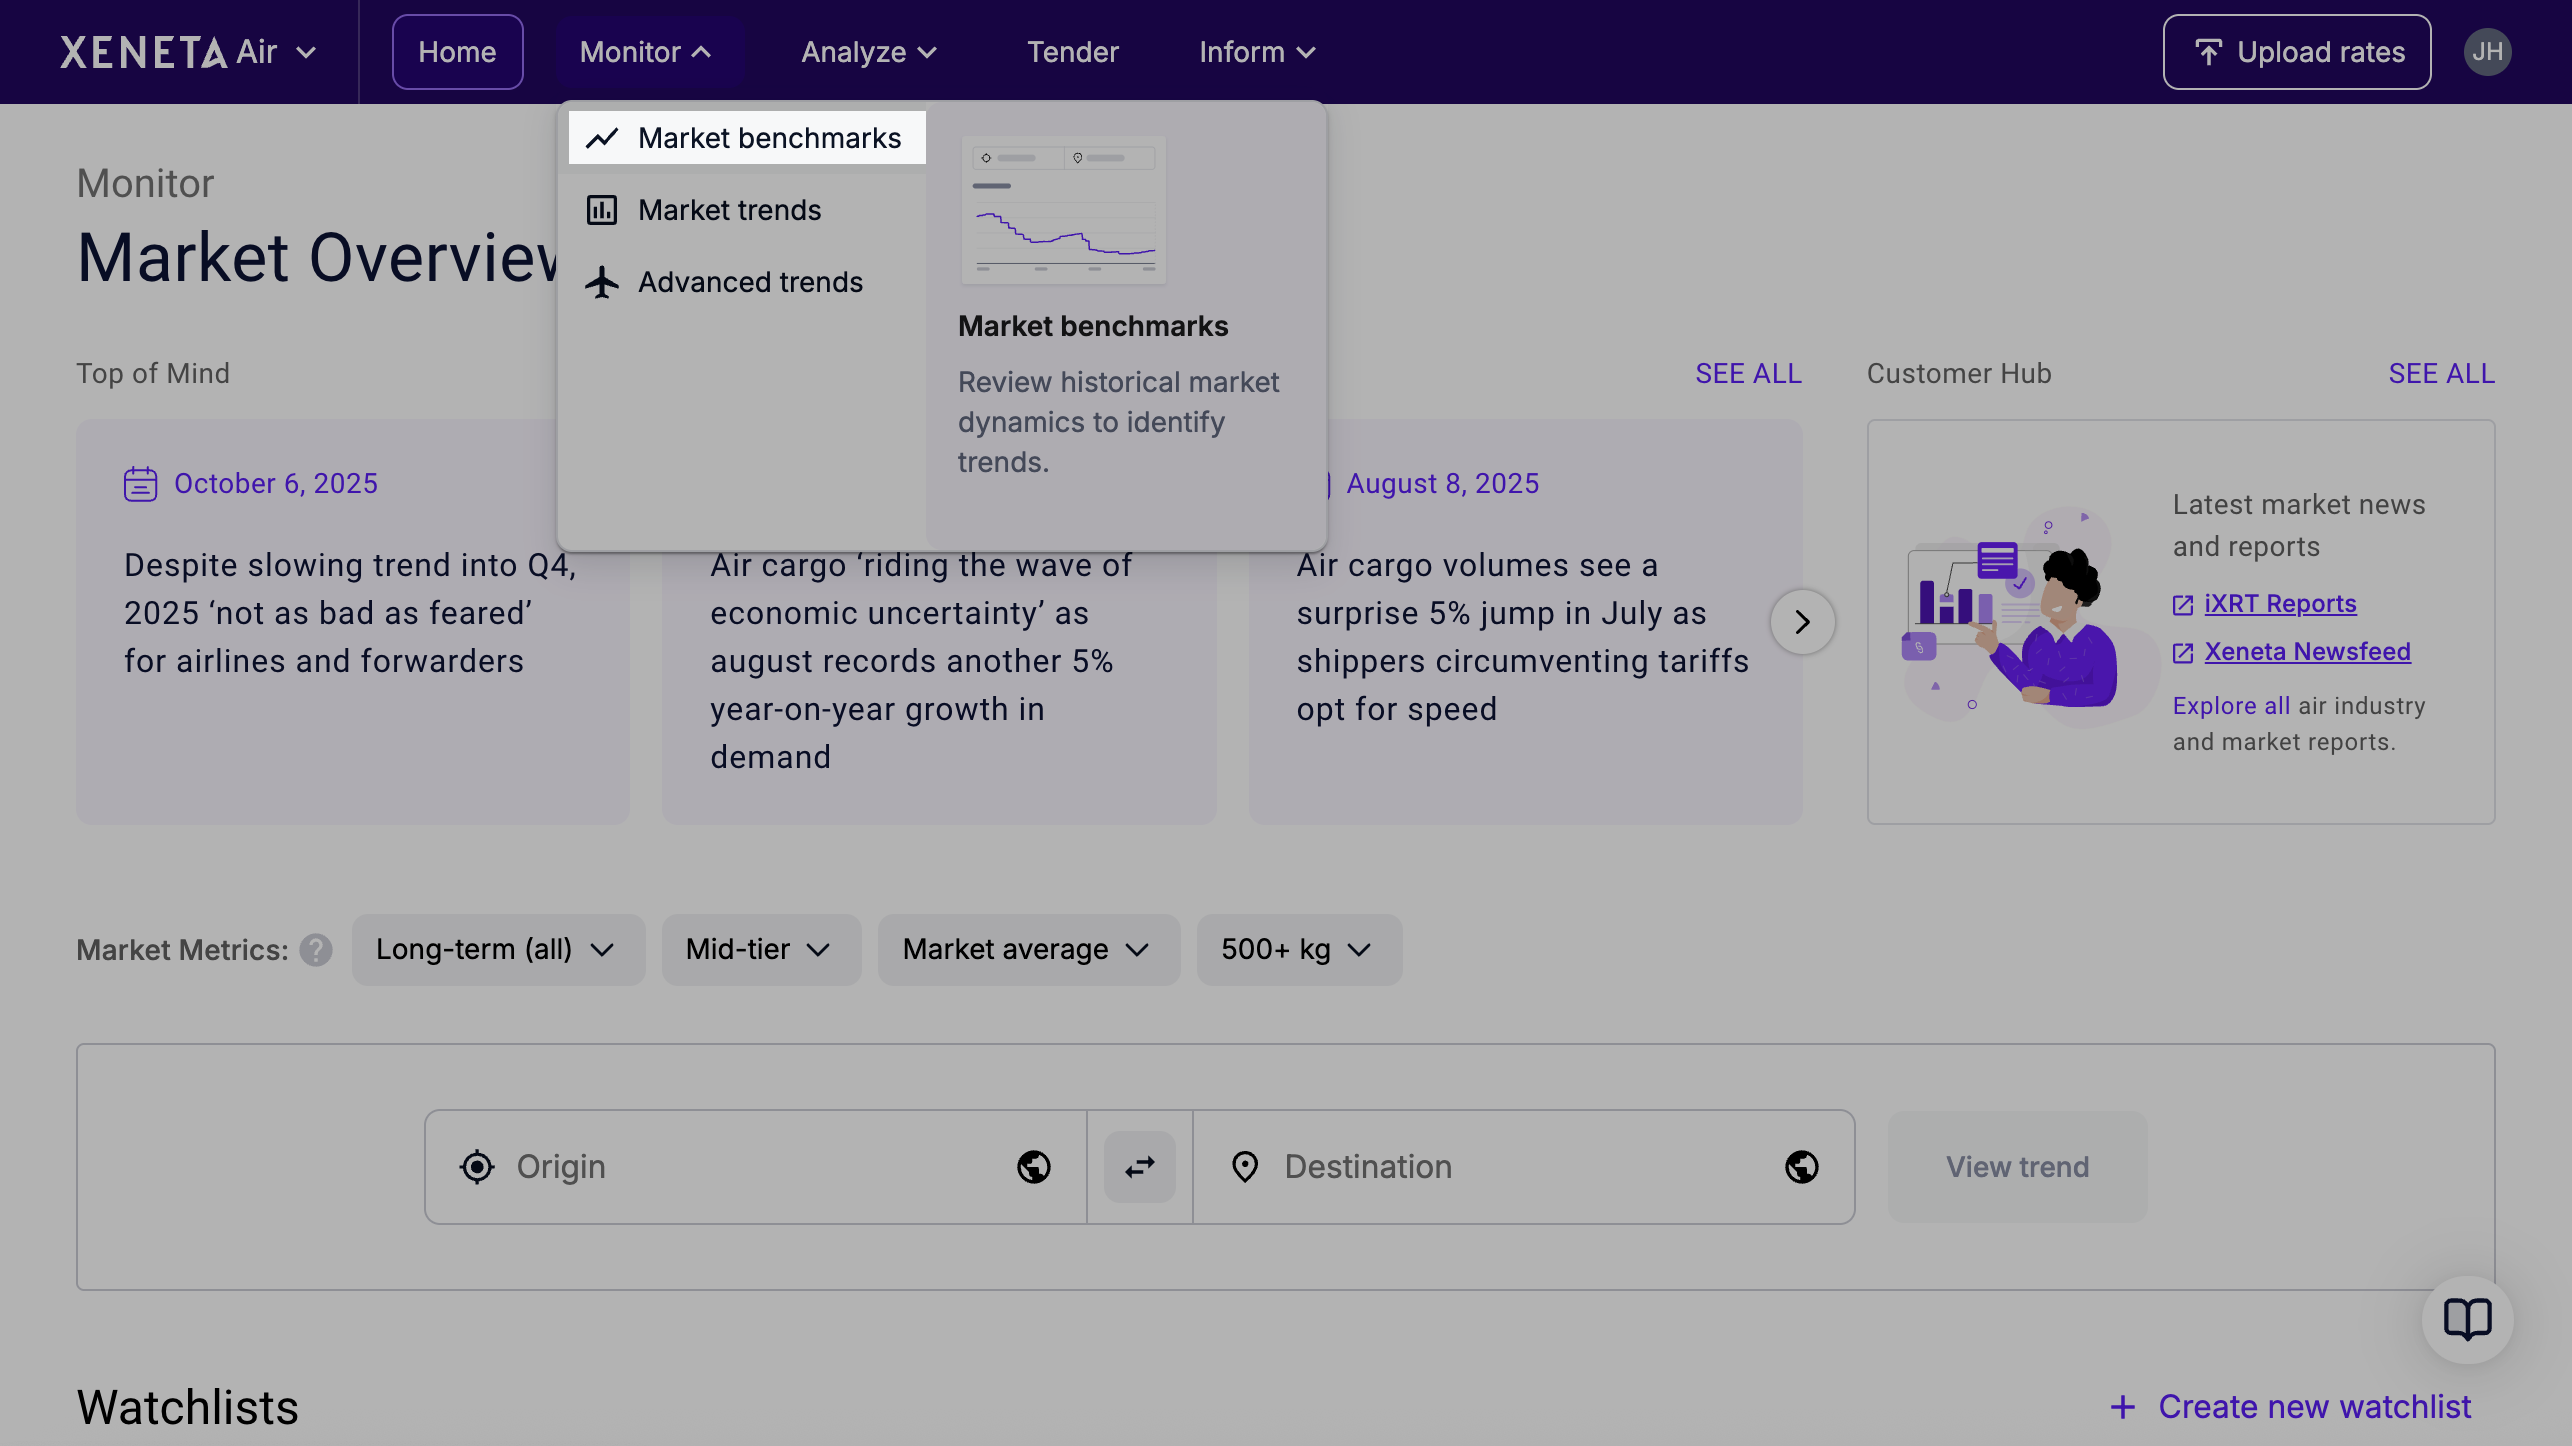
Step 1. Navigate to Market Benchmarks
In Market Overview, hover over the 'Monitor' tab and click on 'Market benchmarks'.
Step 2. Add data
Once you've been directed to Market Benchmarks, you'll see you have a lot of options to explore. We will take you through each configurable option, so you are empowered to become informed buyers, sellers, and negotiators.
Starting on the left-hand side, you will see a panel with all of Xeneta Air's datasets.
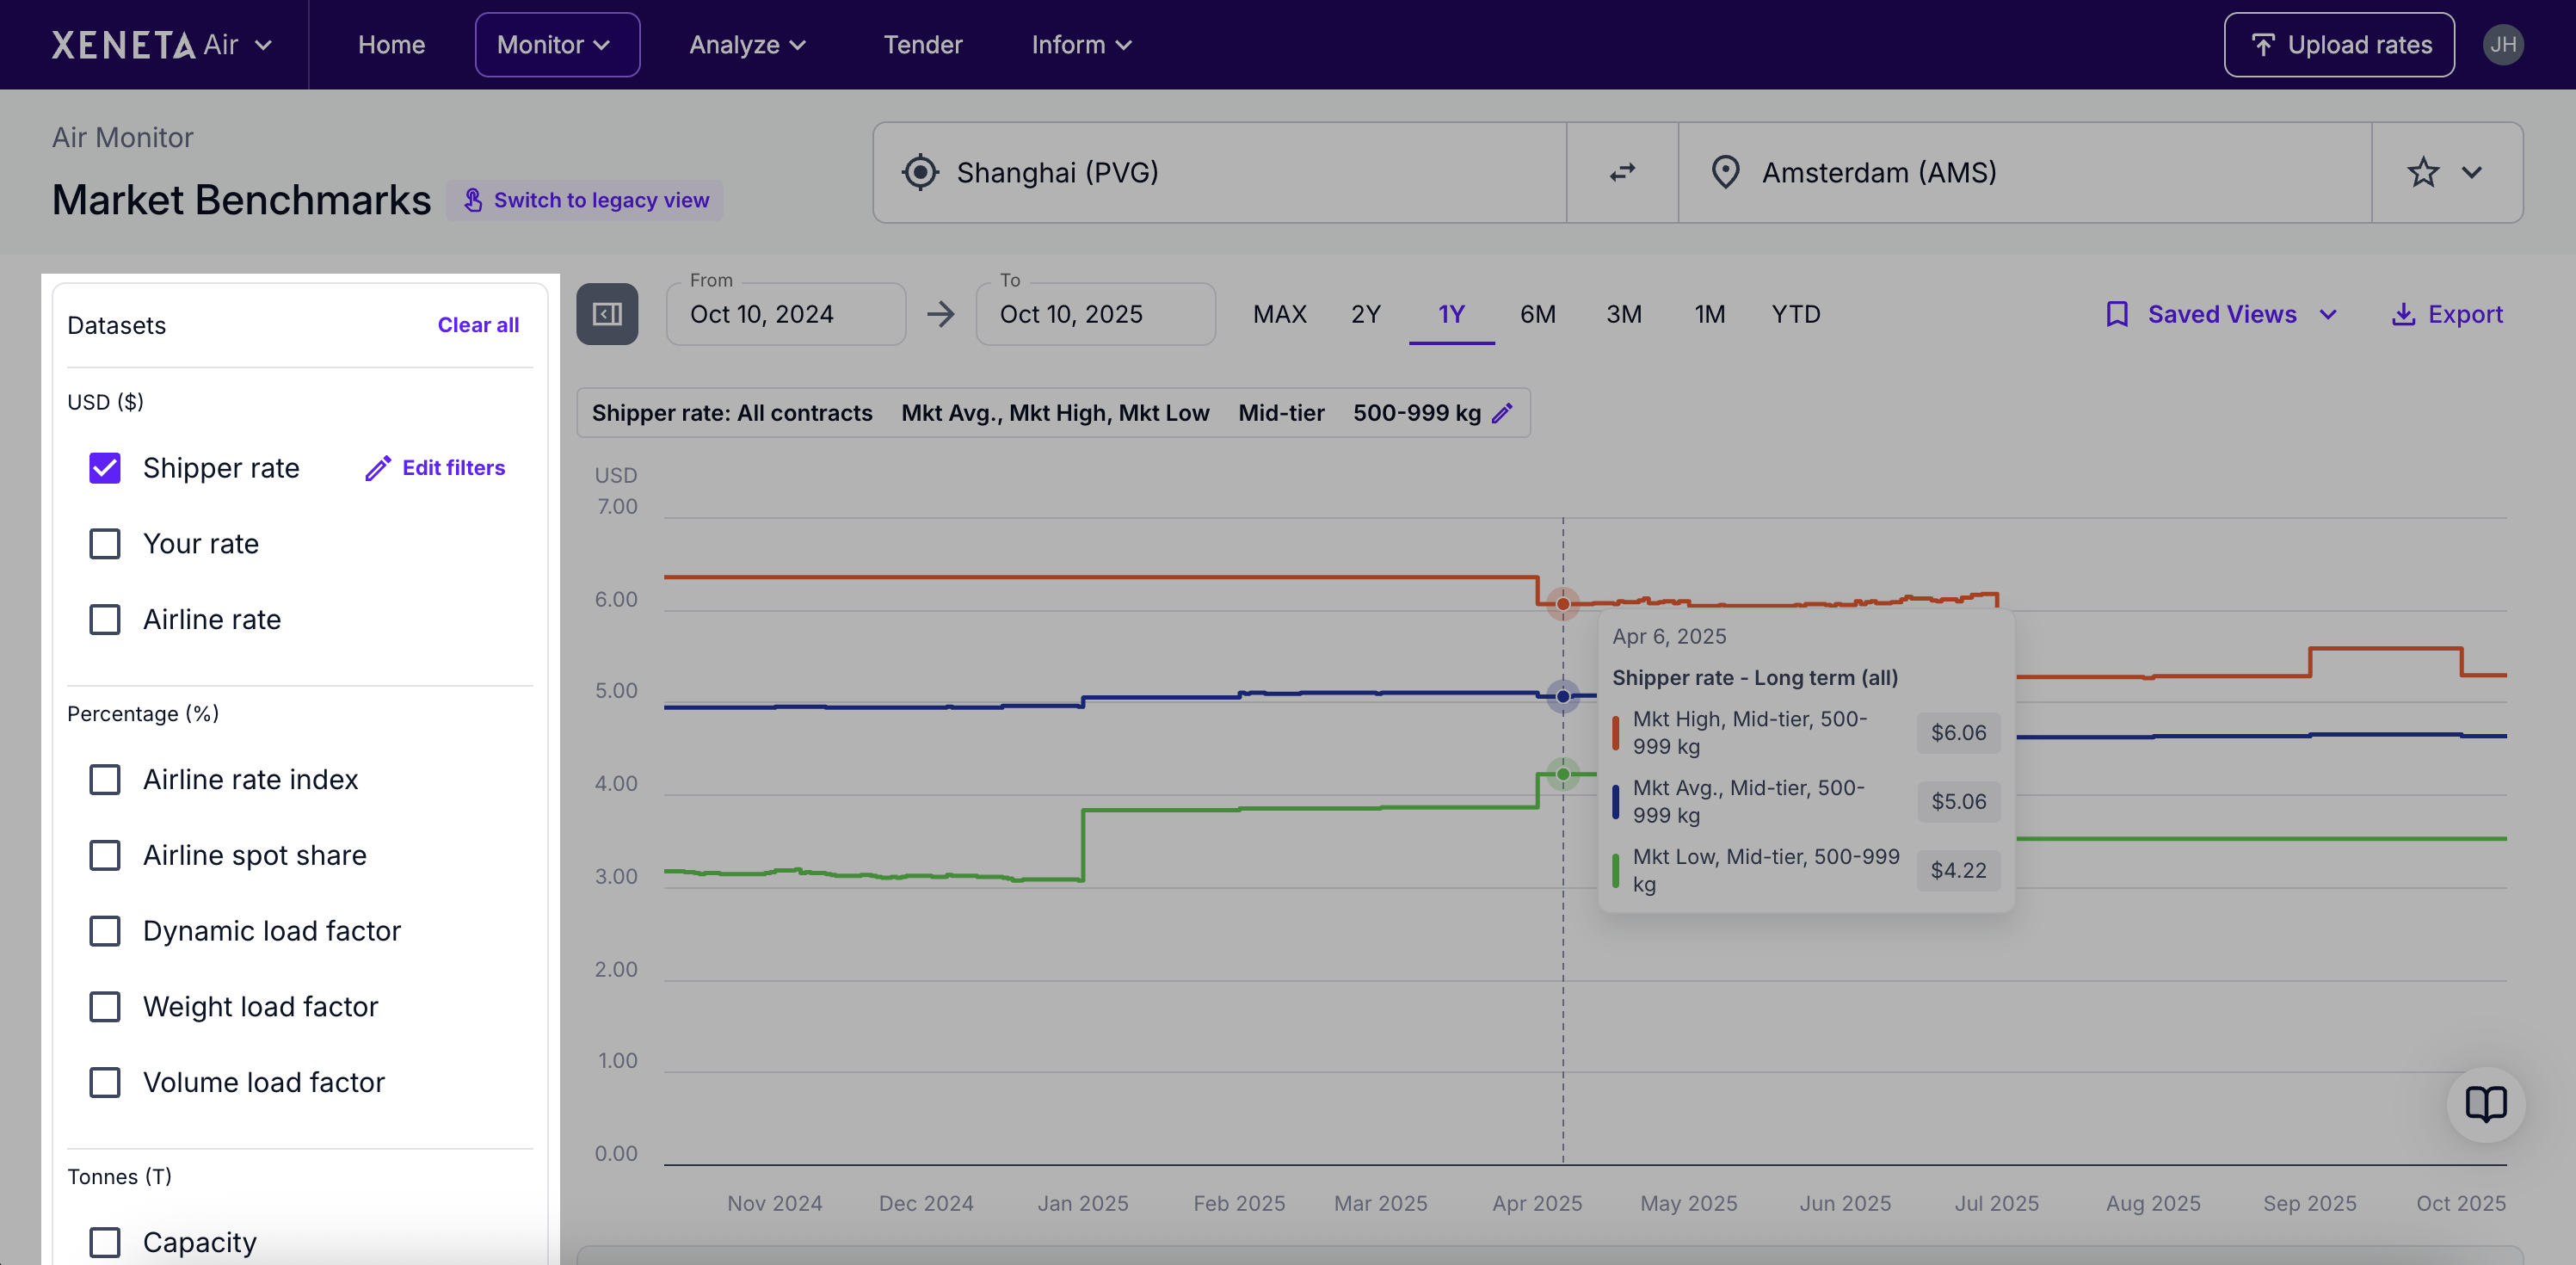
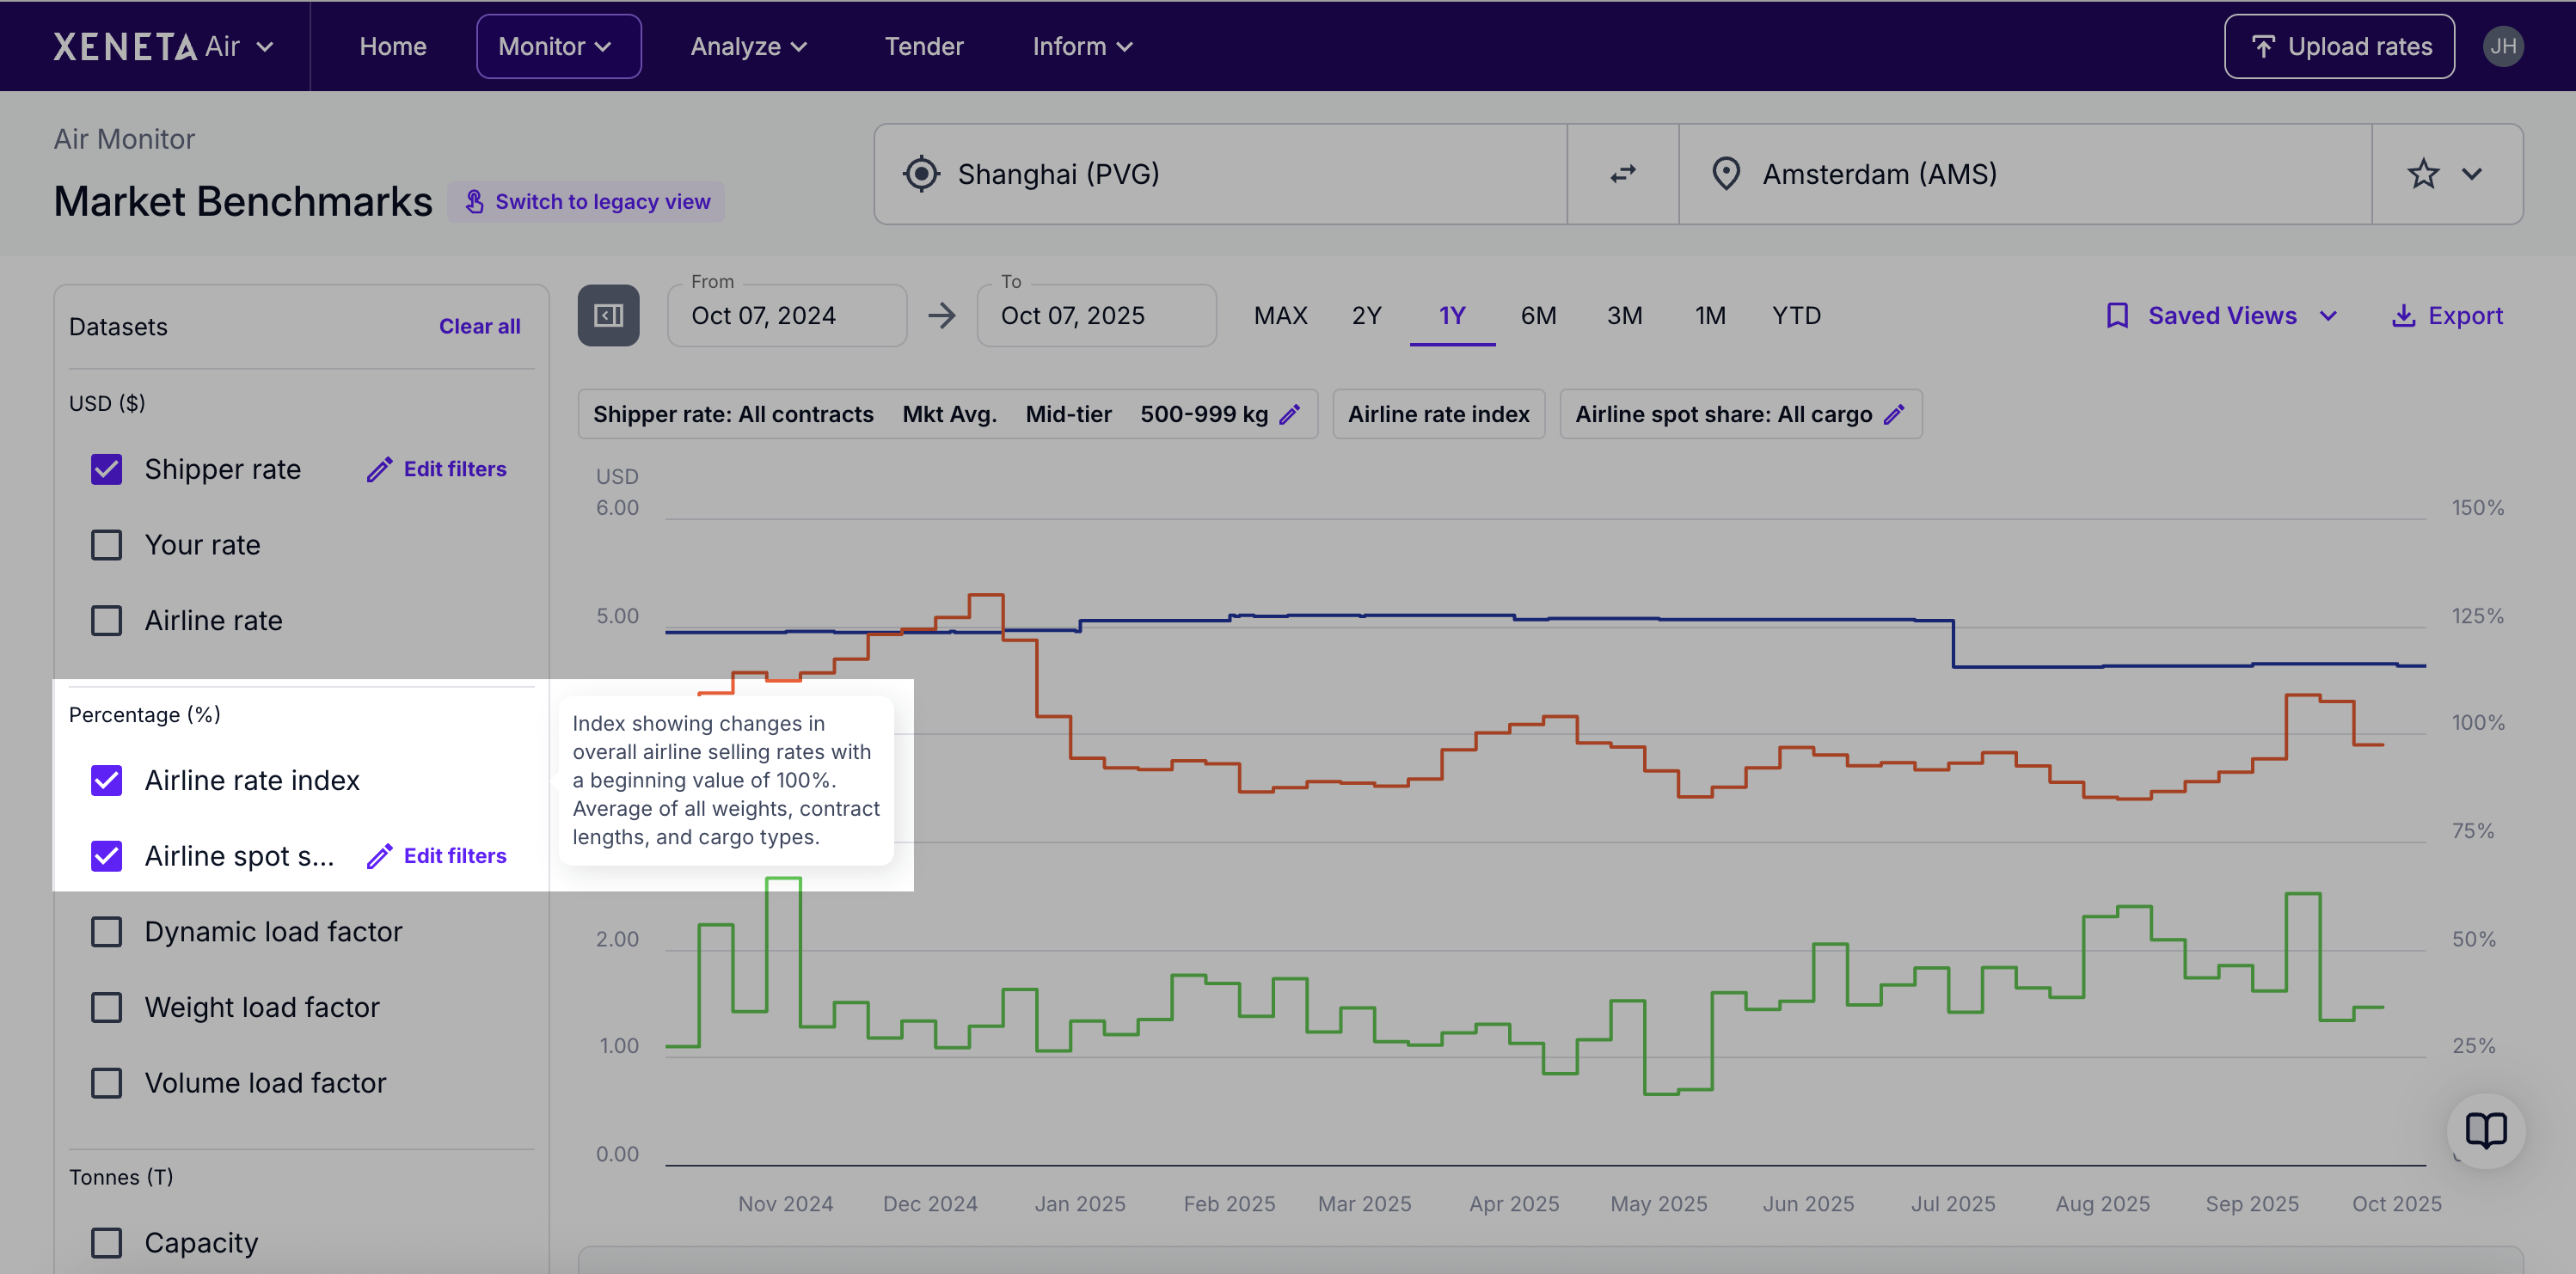
Hover over the datasets for a short explanation of what each dataset is.
You can check and uncheck the box to show or hide that dataset on the corresponding graph (right).
You have further options to customise what type of data you see on the graph. To do this, select Edit filters on a dataset to choose the segments of the market, weight category, service level, and contract type. Please note that not all datasets that this 'Edit filters' option.
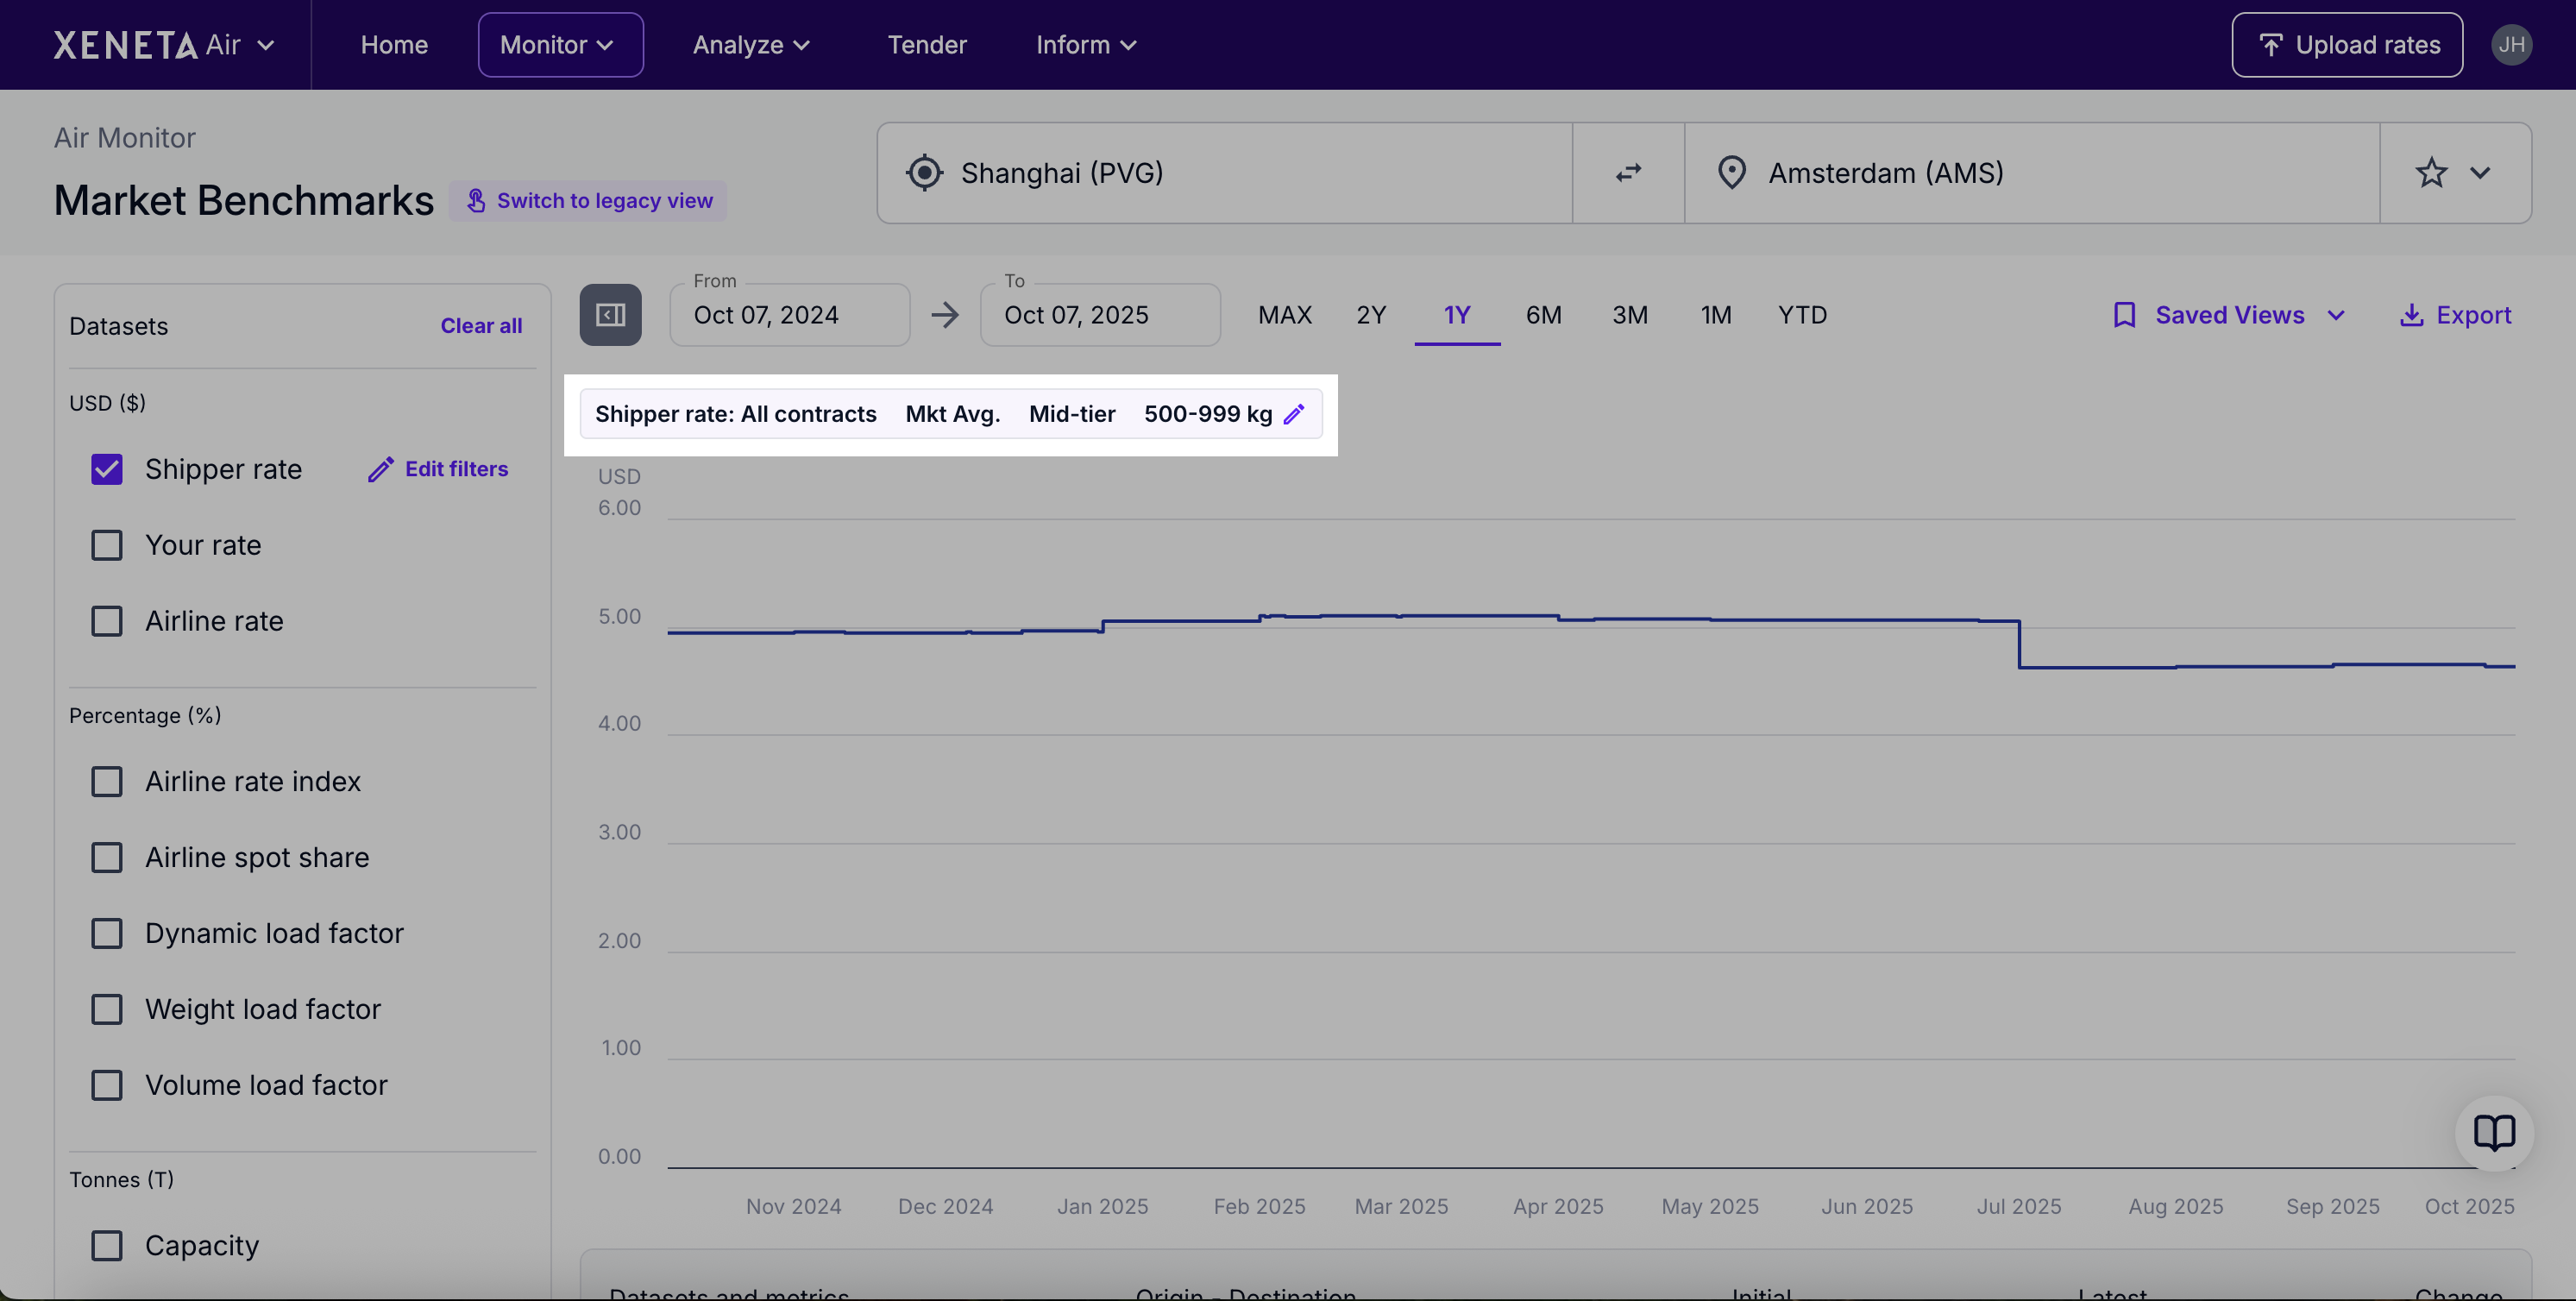
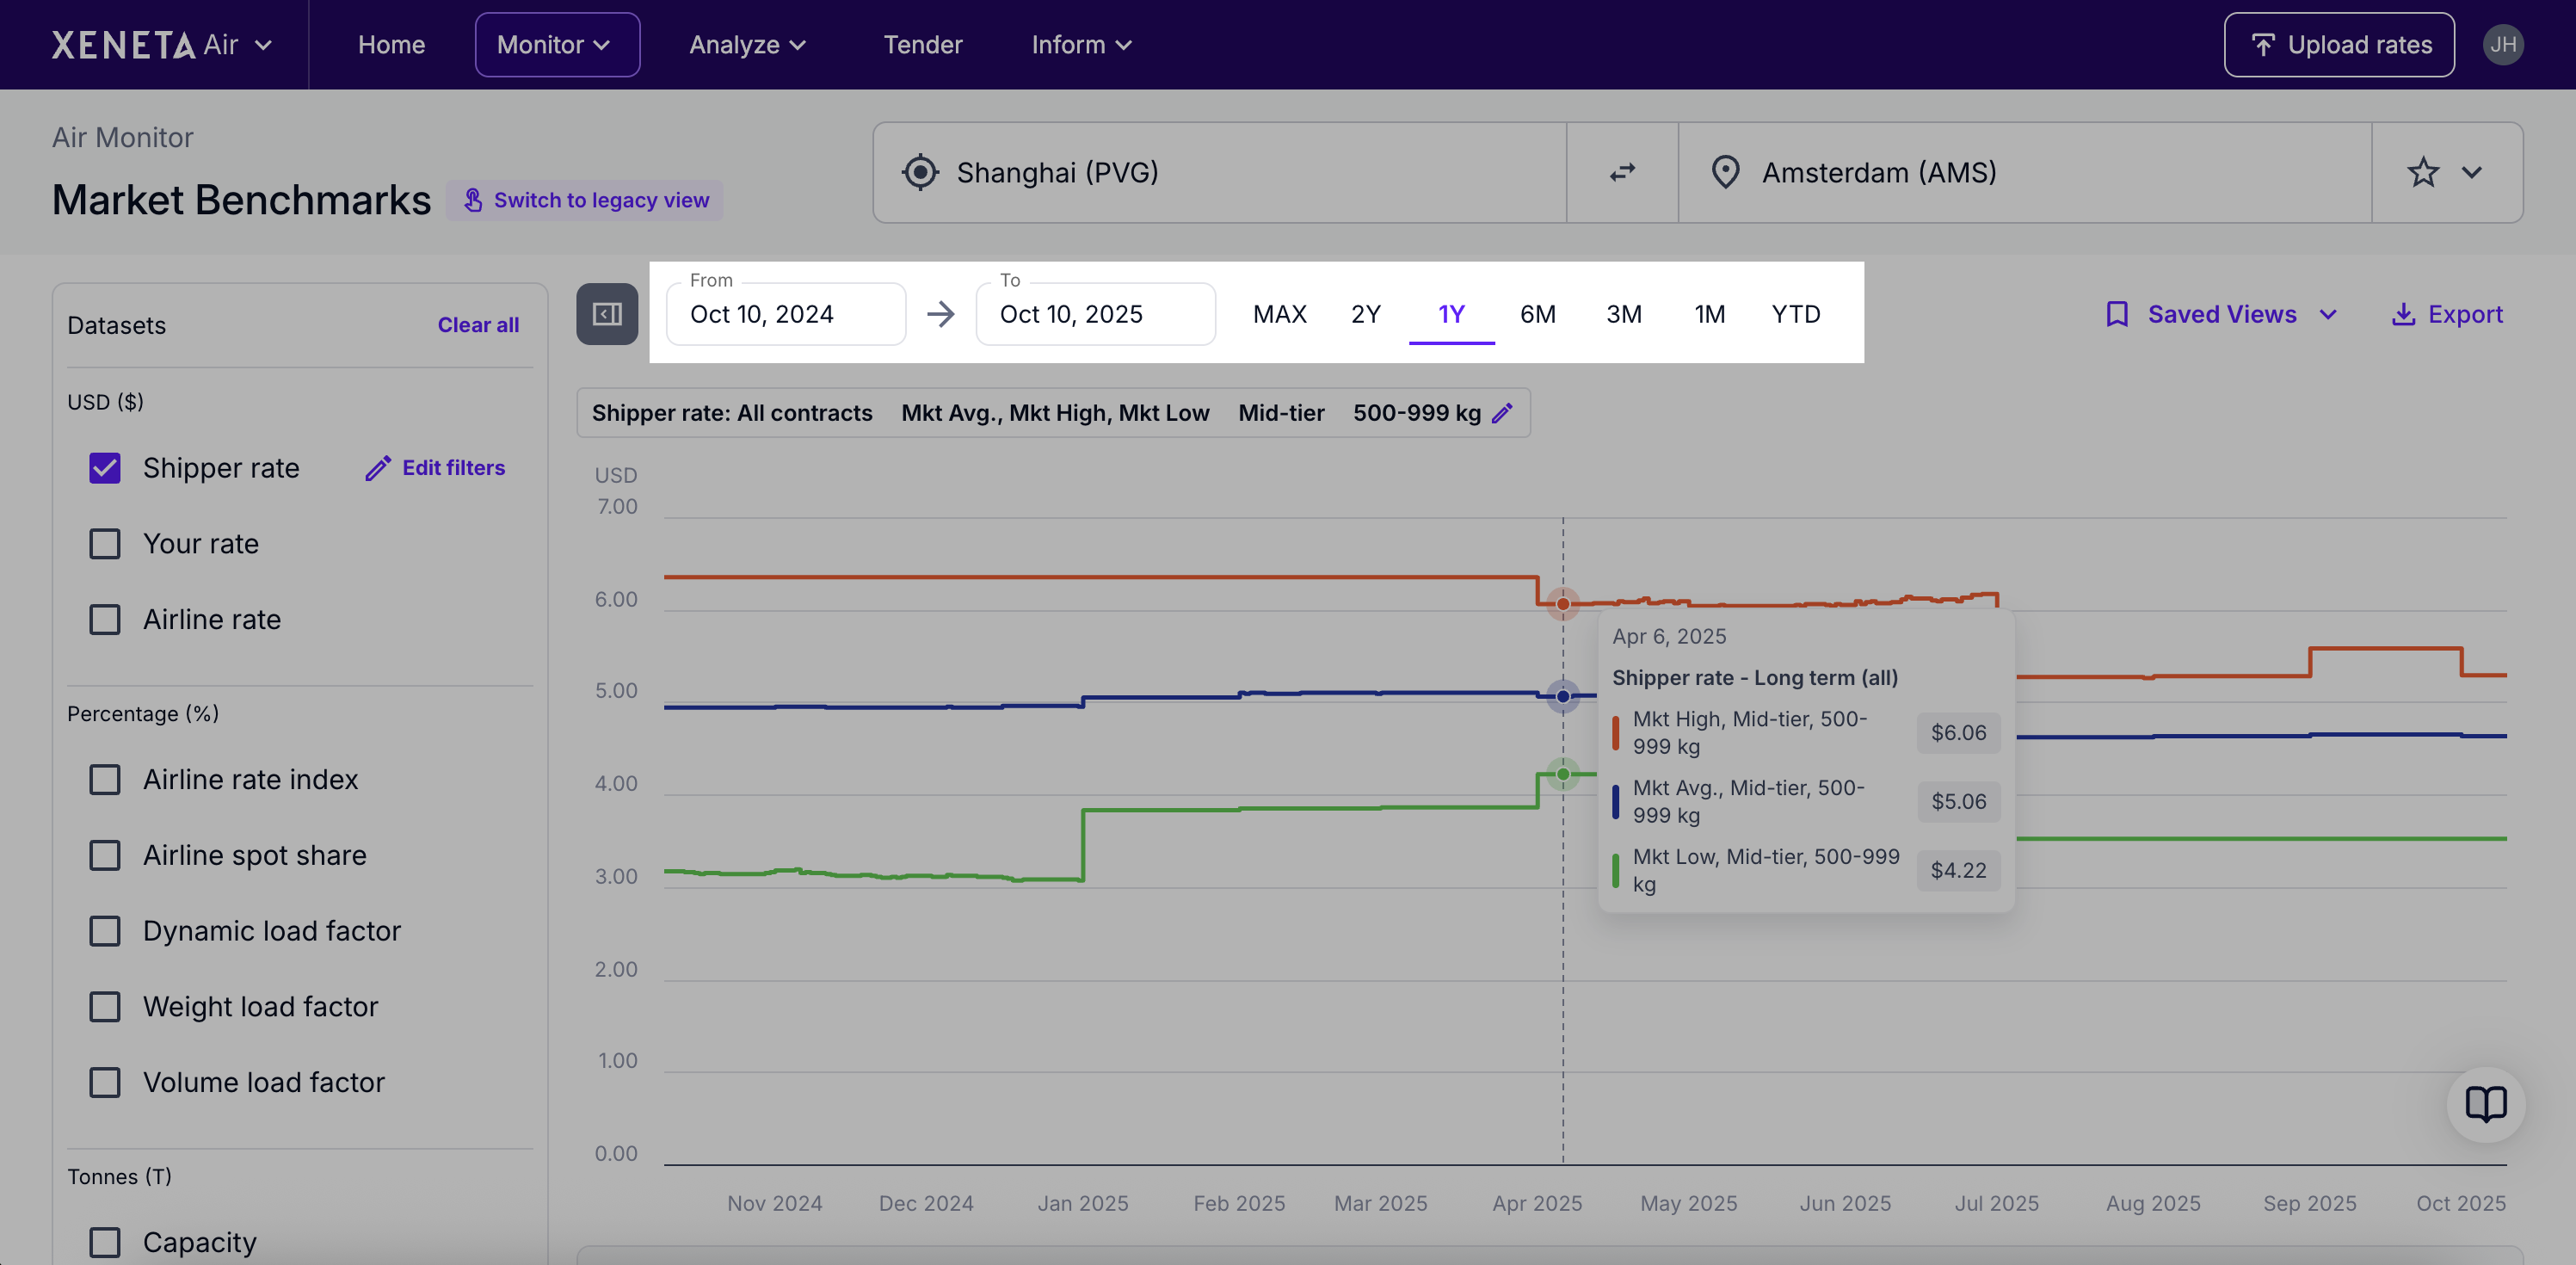
Once you have your datasets loaded in, you can quickly and easily change data filters by clicking the pencil on your filters (displayed above the graph - see screenshot below).
Step 3. Select date range
Once you've selected your data, you can adjust the graph's date range using either preset period (e.g. 1 year) or manually select exact start and end dates using the date selector on the left.
Updated 3 months ago