How to view capacity and load factor data
This quick guide will show how you can access air market capacity and load factor data, see how it has developed over time, and how it correlates with market rates on seven of the largest global trade corridors.
Step 1. Go to Market Trends
Go to Market trends and click on the Capacity & DLF vs Rates tab:
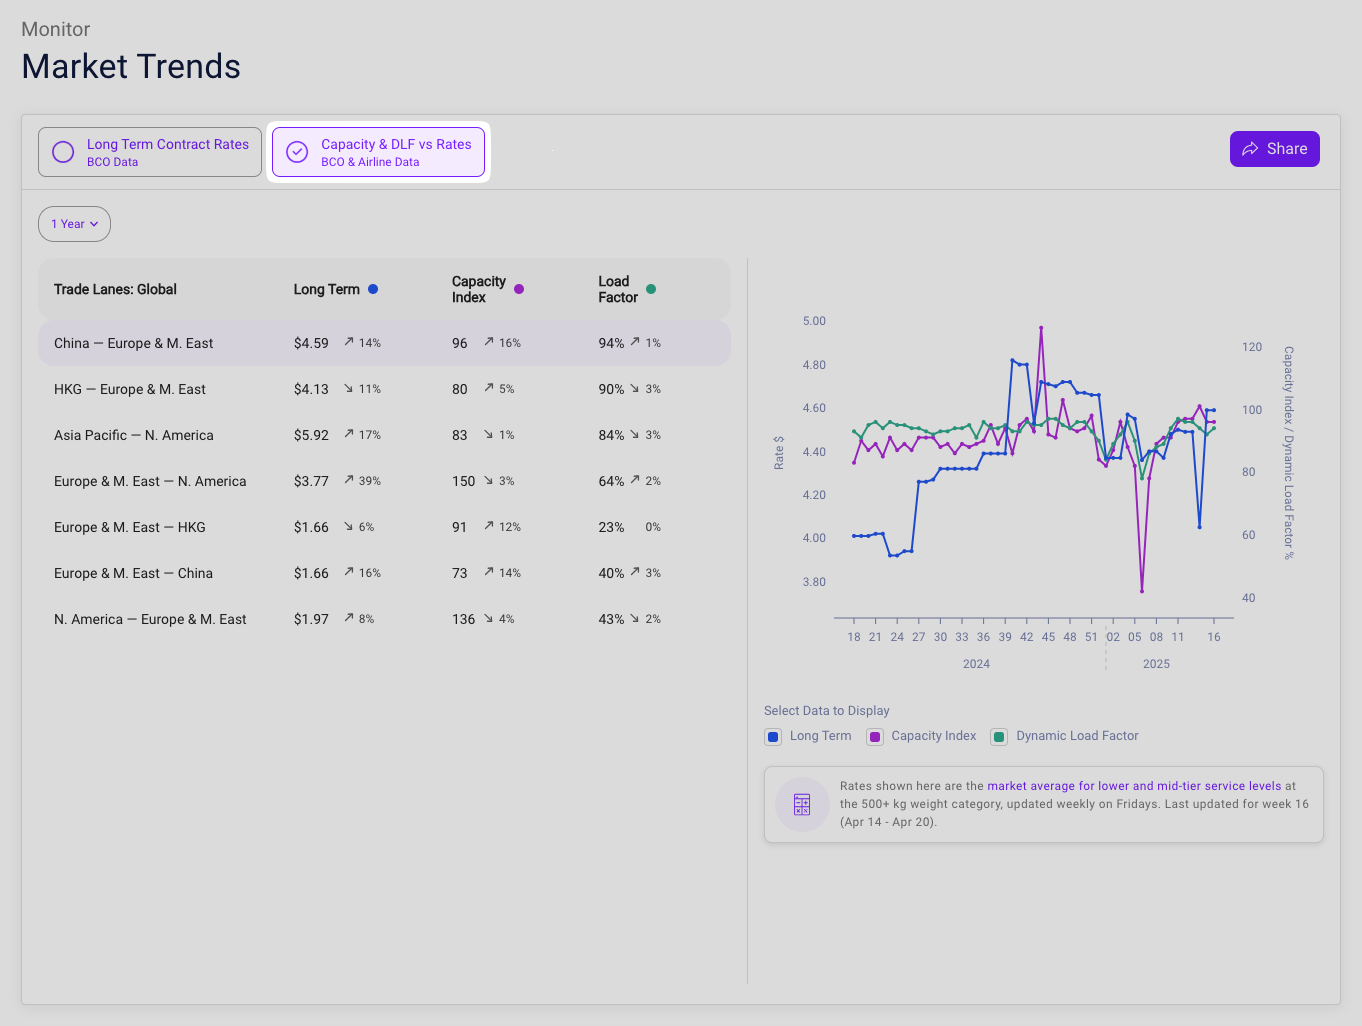
The data presented under this tab is visually divided into two sections:
- List of largest global corridors with current rate, capacity and load factor values
- Chart with historical changes in rates, capacity and load factor on the selected global corridor
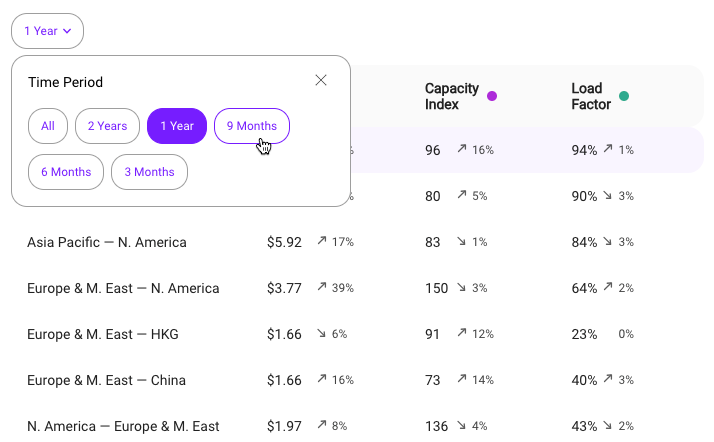
By default, this view shows you historical data over the past year, but you can select a different time period:
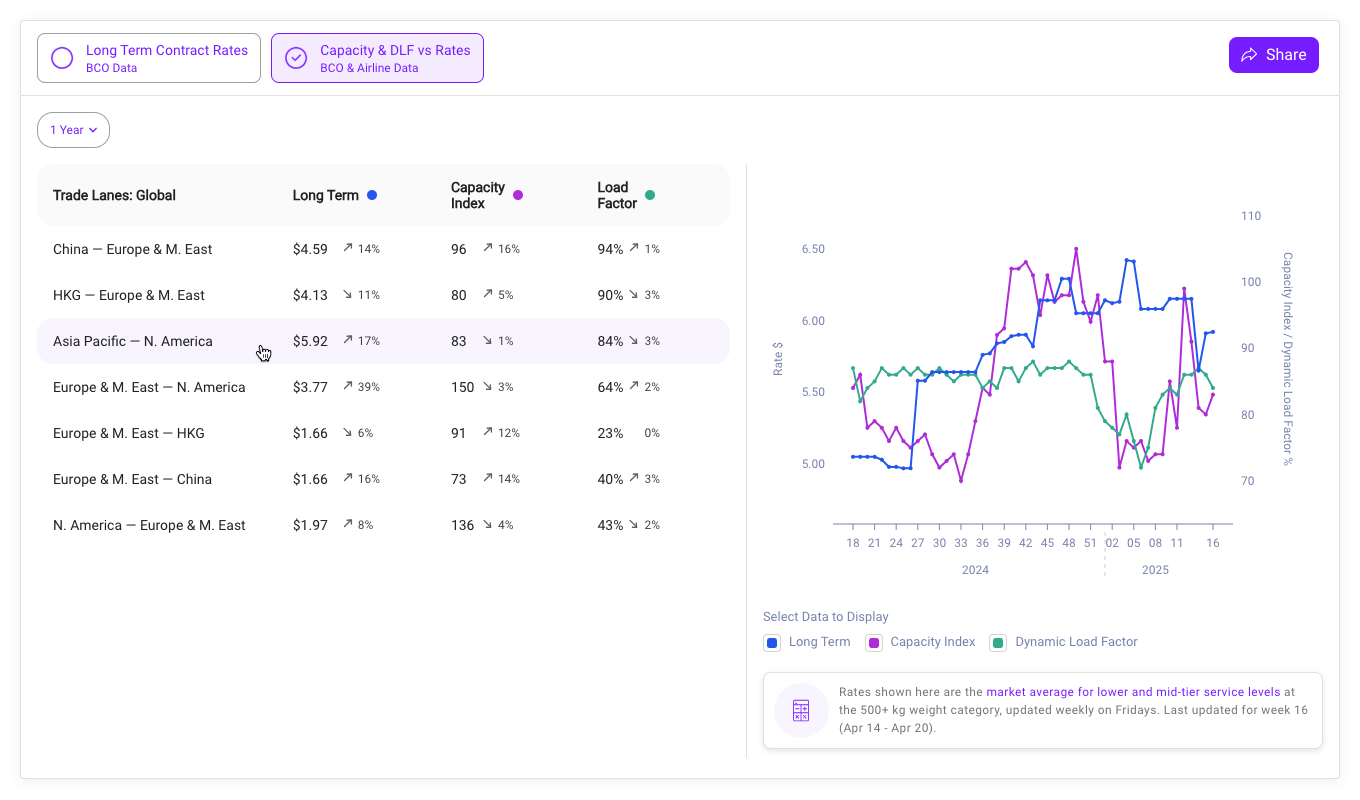
Step 2. Select trade corridor
Select from the list to review the capacity, load factor, and rate dynamics on a specific corridor:
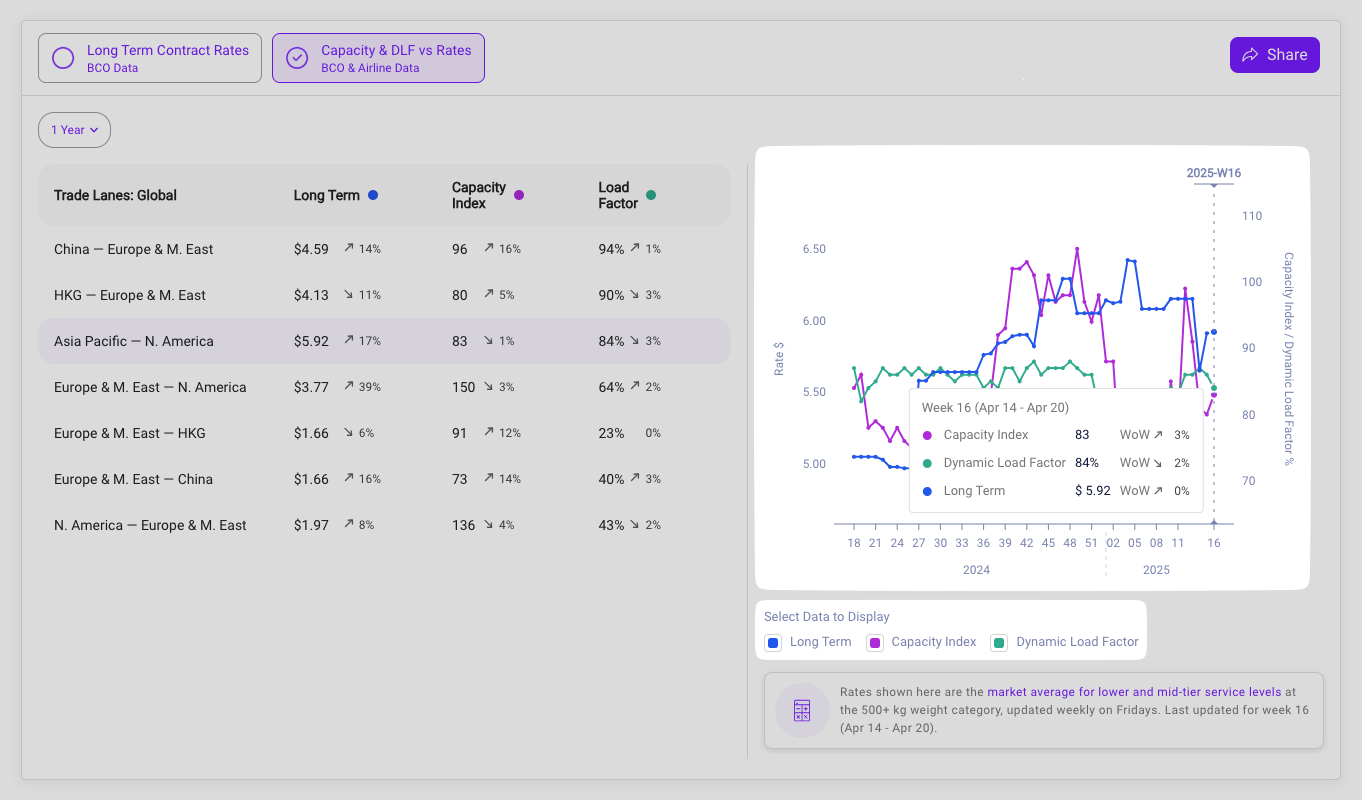
Step 3. Review historical development
Select which specific data points you want to see on the chart, and then see how they correlate and develop over the selected time period:
Updated 4 months ago
Did this page help you?