Market trends | Air
Does your view look different?
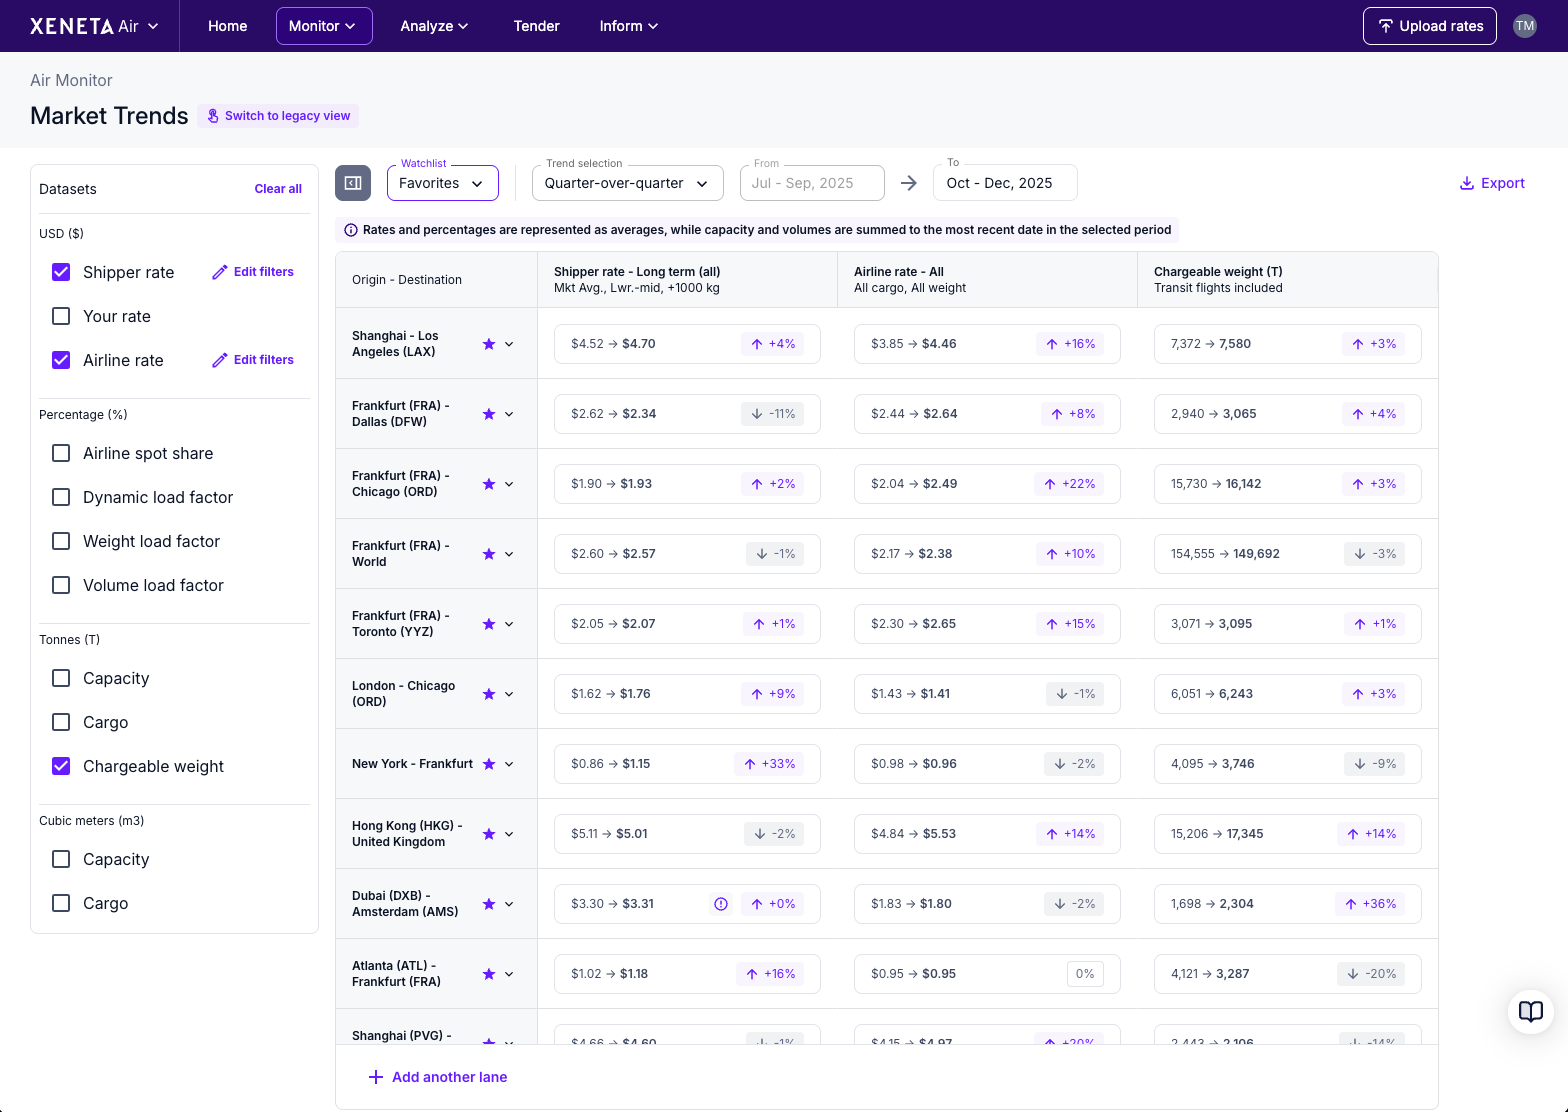
You’re viewing the updated Market Trends experience. If you’re on Air Discover, you can switch to an alternate view here.
Market Trends gives you a quick, at-a-glance view of how the air freight market is moving across your key lanes. It is designed for frequent monitoring, helping you spot changes in price, supply, and demand between tenders, and compare lanes during strategic planning.
You can analyse market movements across different time horizons, depending on whether you want to monitor recent changes or understand longer-term patterns:
- Week-over-week (WoW): Monitor the most recent market movements
- Month-over-month (MoM)/Quarter-over-quarter (QoQ) : Analyse trends across a longer period
- Year-over-year (YoY): Understand seasonality and longer-term market behaviour
- Custom: Compare any time periods relevant to your analysis, such as tracking market trends since your last tender date.
You can analyse up to 12 Xeneta Air datasets in a single table and customise your view with up to 20 columns.
Use watchlists to track the market
Use Watchlists to monitor all sides of the air freight market in one place. From the Watchlist dropdown, you can create, edit, or delete watchlists as your focus changes.
Each watchlist can include up to 60 trade lanes and corridors, and any filters or table customisations you apply are saved automatically. This allows you to return to the same market view without needing to set it up again.
View detailed performance
When you need lane-specific context, you can move directly from Market Trends into Market Benchmarks. Simply click any tile in the table to explore detailed historical performance for a specific dataset.
Together, Market Trends and Market Benchmarks provide a connected workflow for monitoring market movements and understanding performance over time.