Estimated rates
Xeneta's core functionality is based on collecting rate data for containers shipped between two specific ports within a given time period.
However, this approach may run into a problem when one or both ports of those ports are within a trade lane with minimal or no container traffic.
To address these instances, we've introduced the concept of estimated rates.
How estimated rates work
Estimated rates allow us to construct what we believe to be a reliable estimate for rates from port A to port B when there's not enough rate data available.
This means we can actually provide a rate estimate between two ports even though we don't have any contract rates for a specific port pair. To understand how we do this, it's important to understand the context of what makes this process possible.
Hub ports & feeder ports
As the sizes of cargo container ships have increased tremendously over the past decades, shipping rates have decreased along with the container vessel capacity. These large shipping vessels cannot enter every port, and thus only travel between the largest and best equipped ports in each region. These large ports are what we refer to as hub ports.
Because smaller ports still need to move container freight between one another as well as between hub ports, they are serviced by smaller vessels that work as shuttles.
These small ports are what we refer to as feeder ports — as they are the ones feeding the global shipping network.
Service chain
To illustrate this chain of service, here is a step-by-step breakdown of the relationship between feeder and hub ports:
- Containers are loaded on to a small or a medium-sized vessel at the origin feeder port
- Containers are shuttled from the origin feeder port to the origin hub port
- Containers are loaded on to a large transcontinental vessel at the origin hub port
- Containers are transported via the transcontinental vessel and arrive at the destination hub port
- Containers are loaded on to a smaller vessel and shuttled to its destination feeder port
At the most basic level, we can see that the rate is typically composed of three legs of the journey, with the origin hub – destination hub being the middle leg.
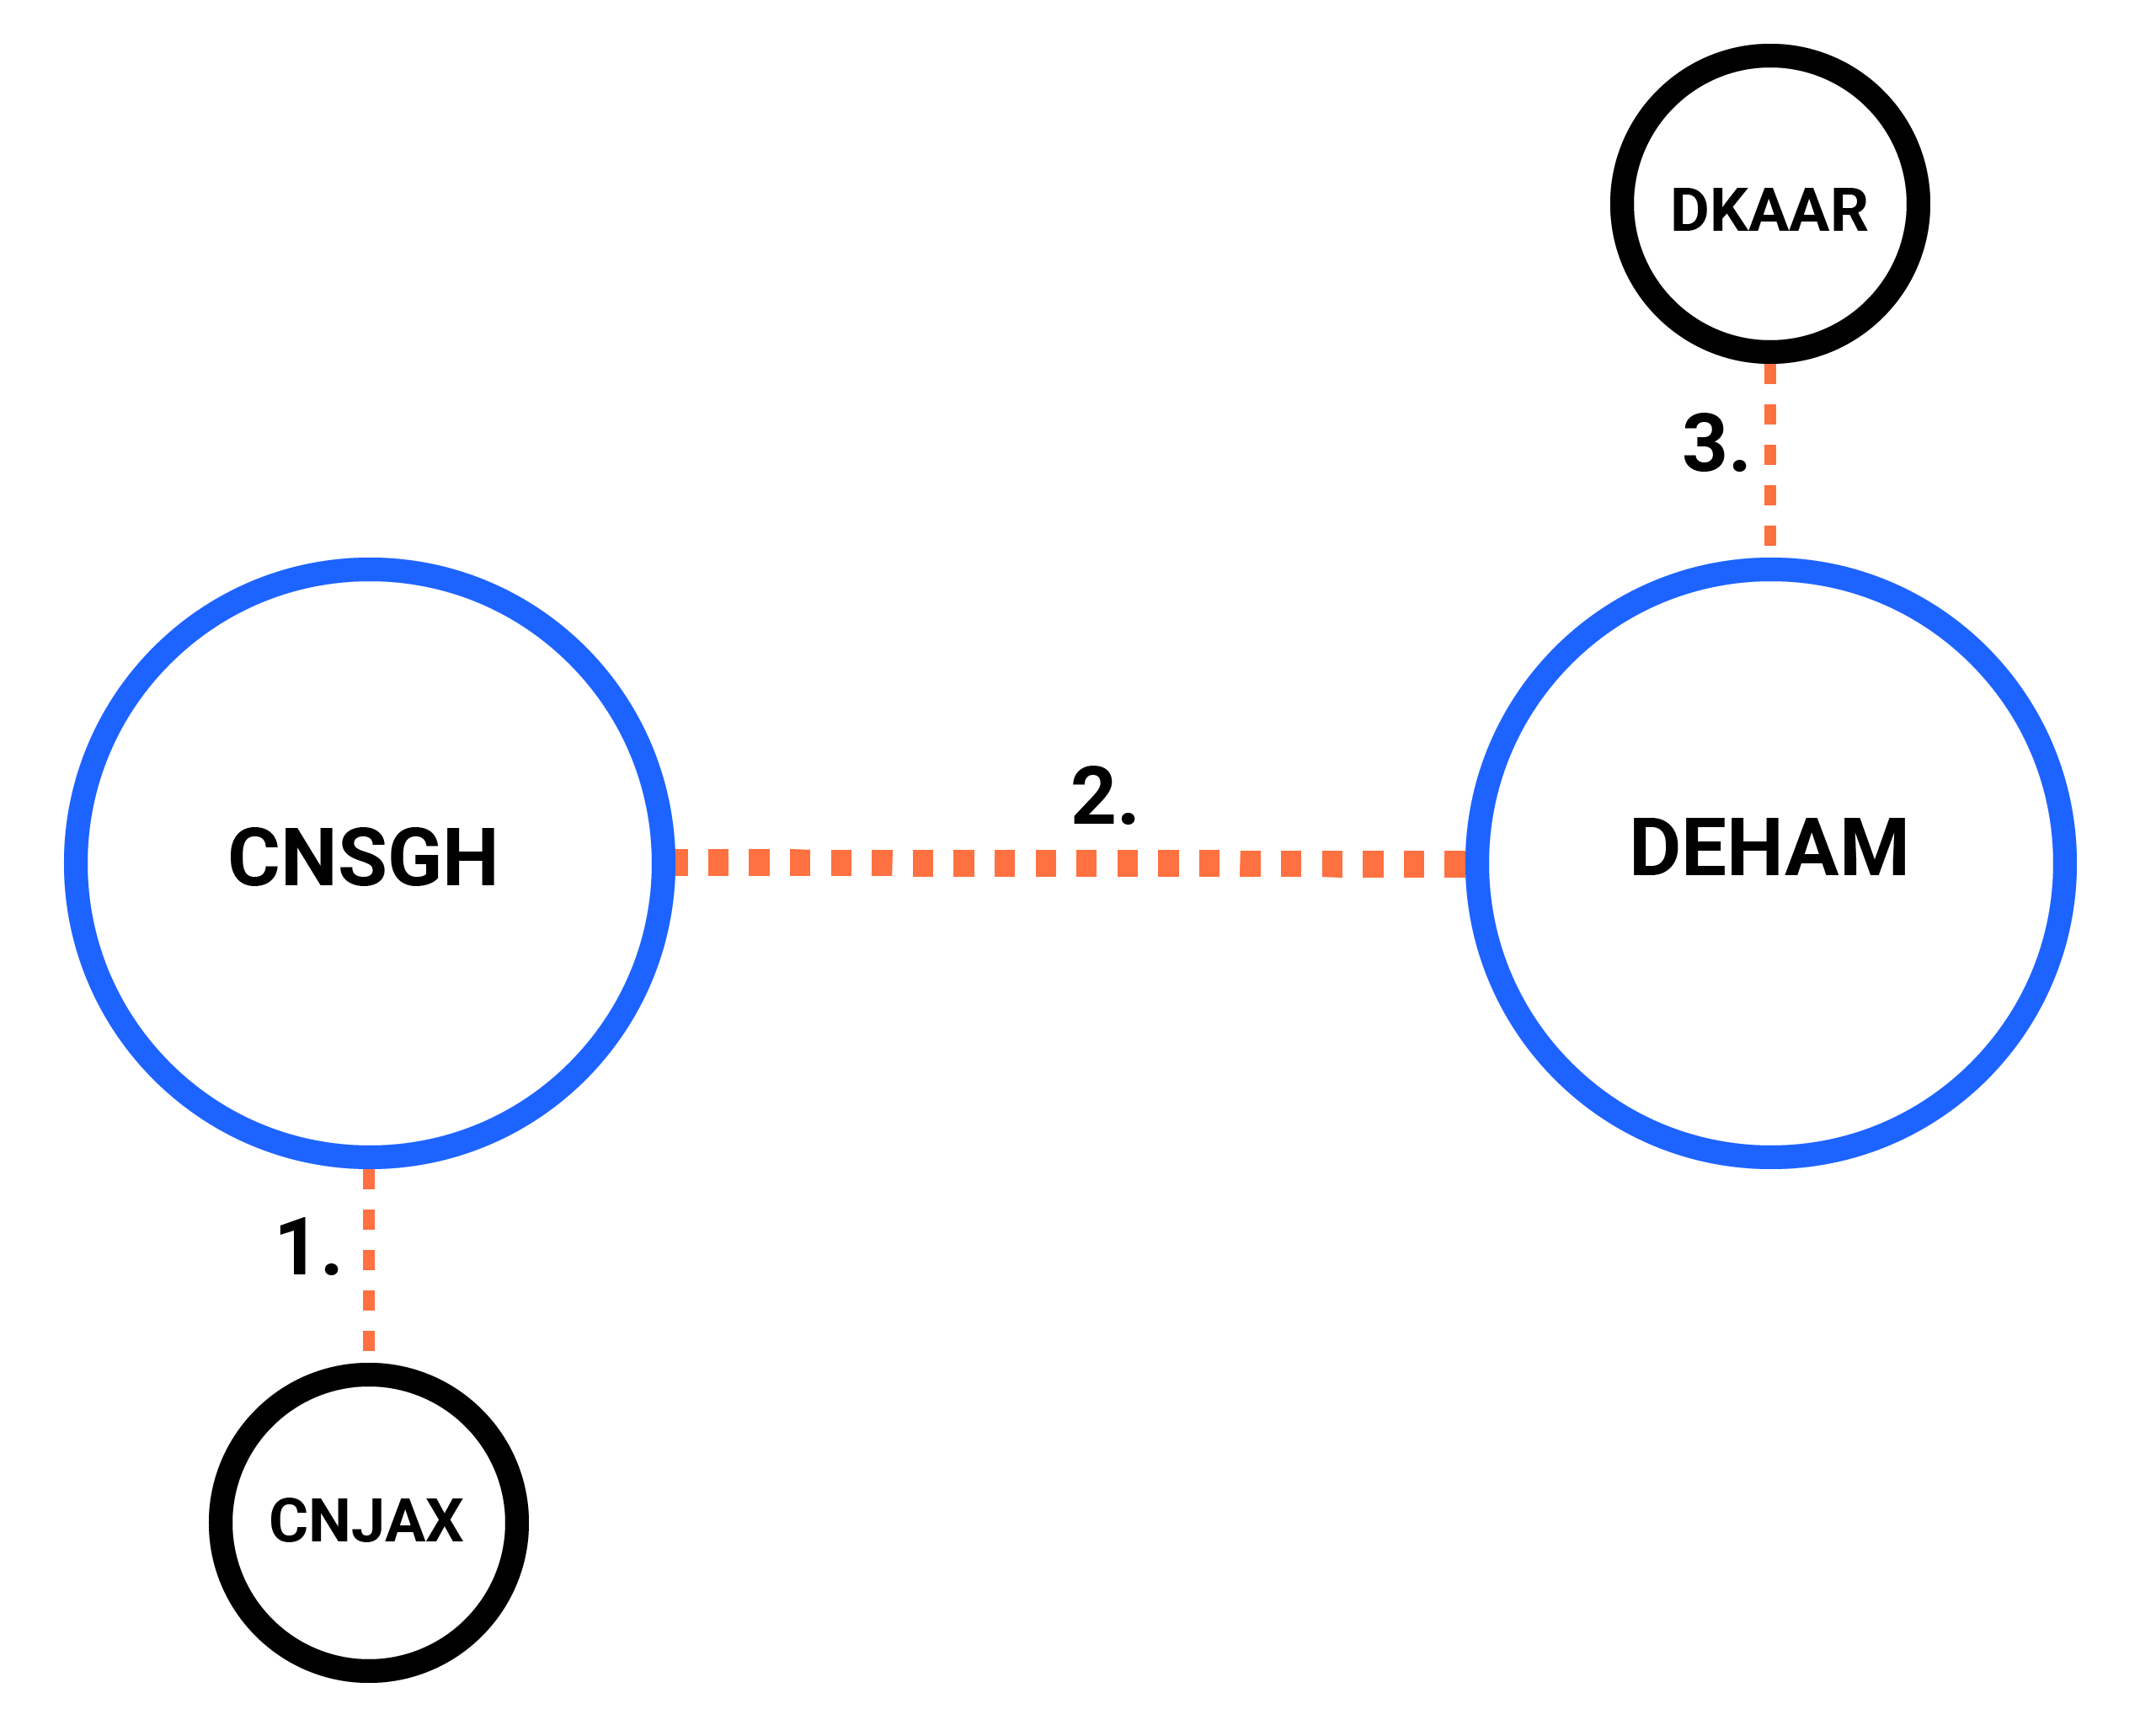
In the example above, you can see the route a container can take to move from Jiaxing, China (CNJAX) to Aarhus, Denmark (DKAAR), with the full journey composed of the following three legs:
- CNJAX to CNSGH (via a feeder vessel)
- CNSGH to DEHAM (via a large vessel)
- DEHAM to DKAAR (via a feeder vessel)
This is how Xeneta is able to provide an estimated rate between two ports even when we do not have any actual rate data for the specific port pair.
Calculation of estimated rates
As shown in the example above, the final rate is not a simple port A to port B journey and consists of several parts.
With this information, we can reconstruct and estimate each leg of the journey based on our available rate data for each leg, and then combine them to get what we consider to be a close estimate of the actual port-to-port rate.
At a very basic level, the formula used to construct a rate estimate (referencing the illustration above) is as follows:
Estimated rate = Leg 1 rate + Leg 2 rate + Leg 3 rate
This article provides only a broad overview of the concept, and that there are many other nuances and complexities related to reconstructing estimated rates.
Accuracy of estimated rates
Xeneta always maintains a pool of contracted rates that are valid within a particular timeframe. Estimated rates are calculated based on current and valid contracted rates, which means that all rate estimates are based on recent contracted rates only.
When estimating the feeder part of the journey, Xeneta only uses the same supplier and company. This is primarily due to differences in rate structure between suppliers, carriers, and companies, so it would make sense to only use the same ones in parallel with each other during the calculation. Once the rates have been matched, added, and averaged, they are then used to construct estimated rates.
Limitations of estimated rates
While we can provide what we believe to be a reasonably close estimate to an actual rate, it's important to remember that it's still just an estimate and should be treated as such.
Rates between feeder ports and main hub ports have very different dynamics. Competition is much more prevalent on trade lanes between main hub ports, making rates more volatile. However, since we tend to have enough contract rates on these main hub lanes, we can generally solve this piece of the equation quite easily.
On the other hand, feeder port rates are relatively stable when compared to trade lanes between busier hubs. Since there are fewer providers and less competition, the rates are less volatile and more predictable.
Updated 3 months ago