Budget outlook tool
Budget outlook is a tool available in Xeneta's Budget section that aims to assist you in your procurement efforts by providing potential budget scenarios that are calculated based on your volume and spend information within the context of the recent market movements across your corridors.
This information can serve as a solid indicator of what your budget could look like if you went to tender now, so you could plan your procurement accordingly.
View your budget outlook
To get started with Budget outlook, select the time period — this will allow us to calculate the market development:
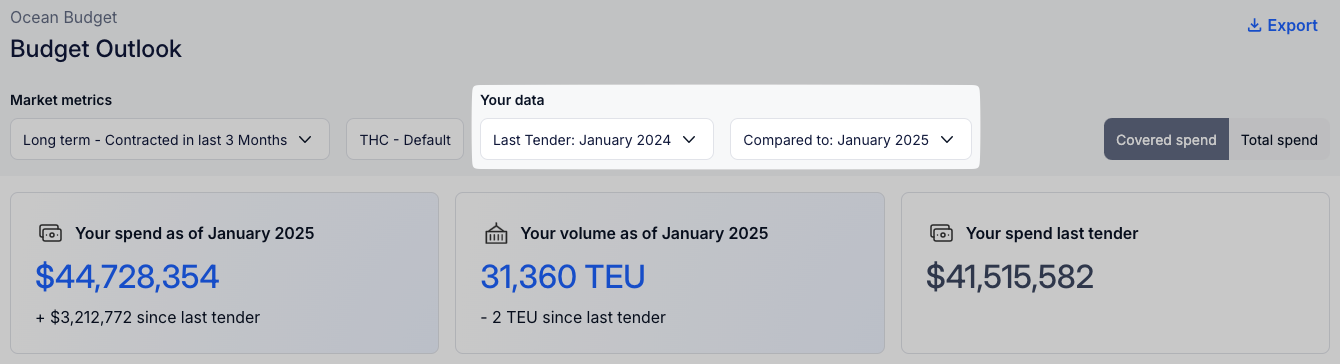
The first date in that time period is the month when your last tendered rates took effect, while the second date is set to the current month by default so we can generate an outlook that shows what spend you could expect if you went to tender today.
You can also select a different month if you want to see an outlook calculated based on market changes in the past.
Next, select if you want to see an outlook for short- or long-term contract rates:
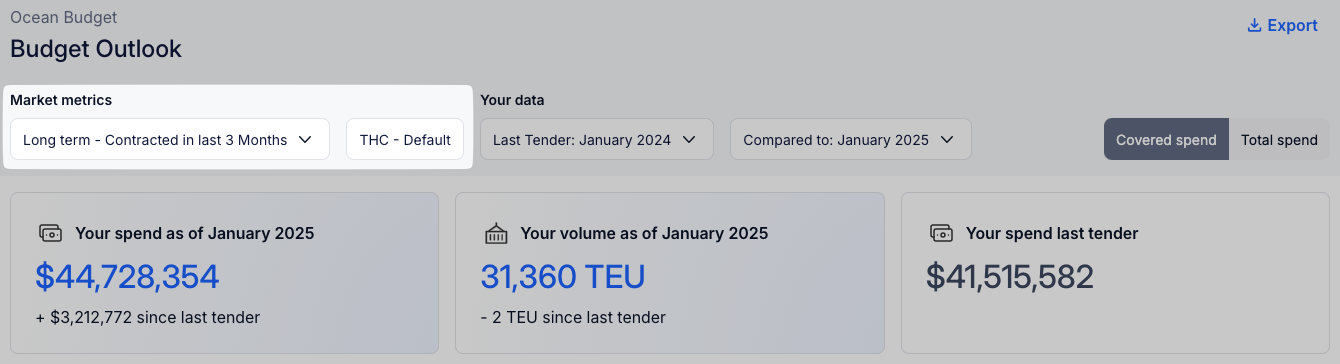
Selecting short-term makes more sense if you negotiate your rates frequently throughout the year, while long-term rates could offer a chance for a better deal if you choose to pursue a longer contract period with your suppliers.
Terminal handling charges included in the market rates that we use in our budget outlook calculations are applied according to our default methodology and depend on the origin and destination region.
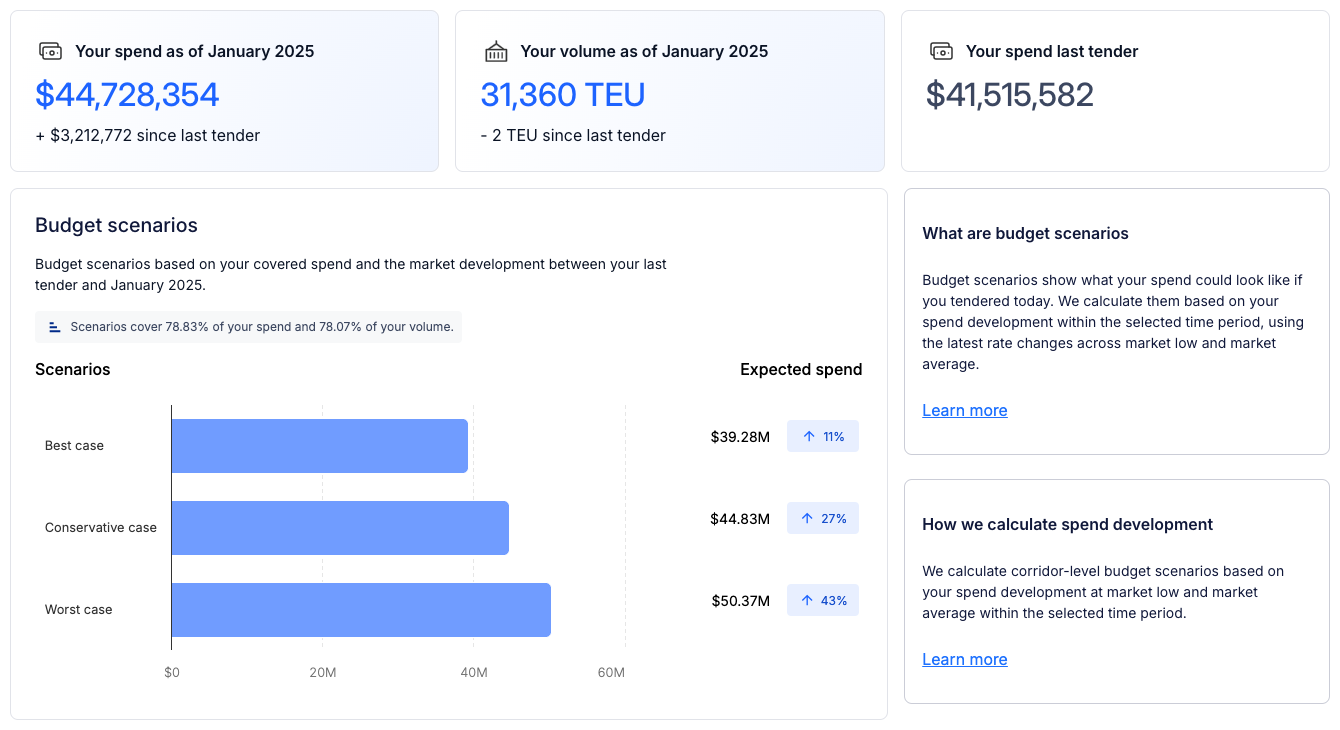
With the dates and the contract length selected, you can now review the Budget scenarios section. Here you can get an idea of how much we expect you to spend shipping your volumes at today's market rates compared to what you spent during your last tender, represented as three indicators:
- Best case — lowest expected spend
- Conservative case — average expected spend
- Worst cases — highest expected spend
Finally, navigate to the Budget scenarios per corridor section to see how the market trends across the low and average segments have affected your spend within the selected time period across your top corridors:
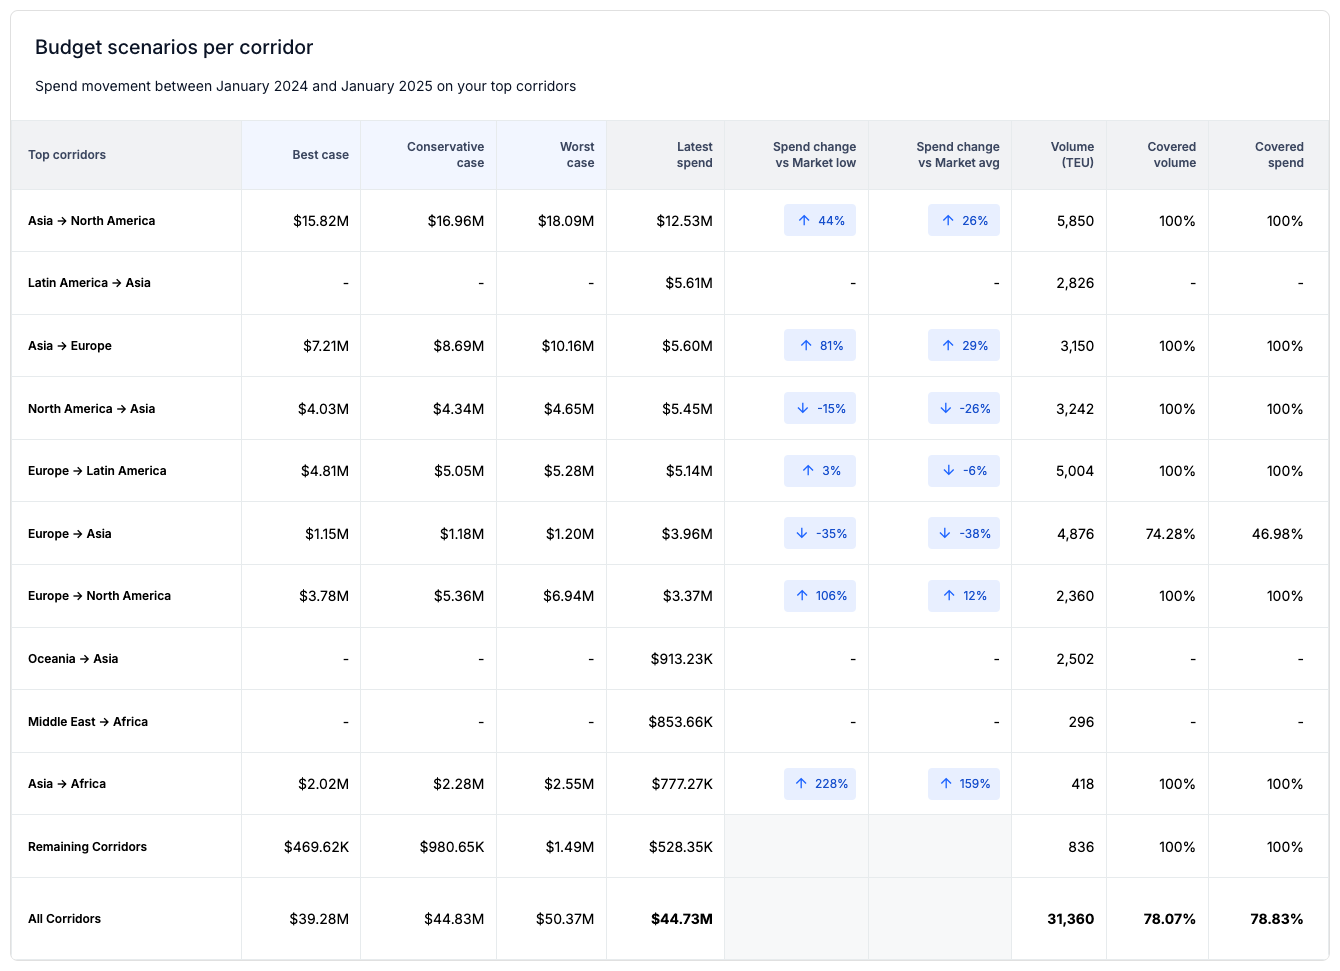
The Spend change vs. Market low and Spend change vs. Market average columns indicate how much your spend would have changed between the two selected periods if all your spend on individual corridors was at the market low and market average level respectively.
Covered and Total spend
By default, Xeneta uses your Covered spend to calculate the budget outlook. If there are gaps in coverage, we can estimate your Total spend and use that estimate in our calculations instead:
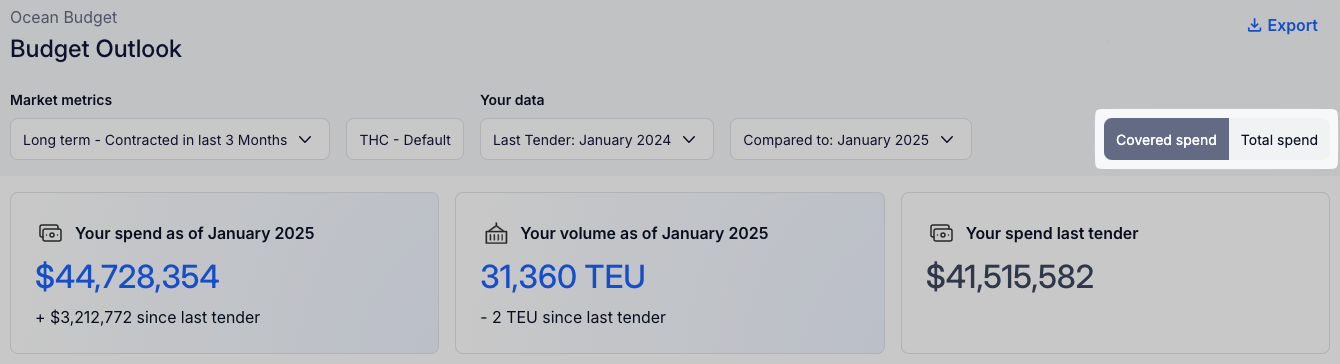
Covered spend is your spend that we can reliably compare to the market across all relevant corridors and container types. Total spend on the other hand, is our extrapolation of your Covered spend where we try to fill in the blanks in your coverage to provide you with a more complete outlook based on your entire spend.
Budget scenarios and spend development
We calculate the budget scenarios provided in Budget outlook by multiplying your latest spend by the change in low and average market rates within your selected time period (adjusted for your spend in each period).
A more detailed formula for each individual scenario would look like this:
- Best case = Your spend x lowest value of the change in spend at market low and market average
- Conservative case = Your spend x average value between the change in spend at market low and market average
- Worst case = Your spend x highest value of the change in spend at market low and market average
For example, let's say that you mainly ship on Asia – Europe and Asia – North America, with your spend on those corridors currently at $100 million and $80 million respectively at 100% coverage — here is how your budget scenarios would be calculated:
| Corridor | Spend | Market low change | Market average change | Best case | Conservative case | Worst case |
|---|---|---|---|---|---|---|
| Asia – Europe | $100M | -40% | -30% | $60M | $65M | $70M |
| Asia – North America | $80M | +10% | +20% | $88M | $92M | $96M |
| Budget scenarios | $148M | $157M | $166M |
Updated 4 months ago