Performance overview
The Performance overview page provides a comprehensive breakdown of different performance indicators that help you keep track of your uploaded rate and volume data and see how your performance compares to a specific section of the ocean freight market in terms of spend.
The functionality of our Analyze pages, including Performance overview, depends on the availability of your volumes and rates in Xeneta. Be sure to provide us with your data without delays to take advantage of all the features that they offer.
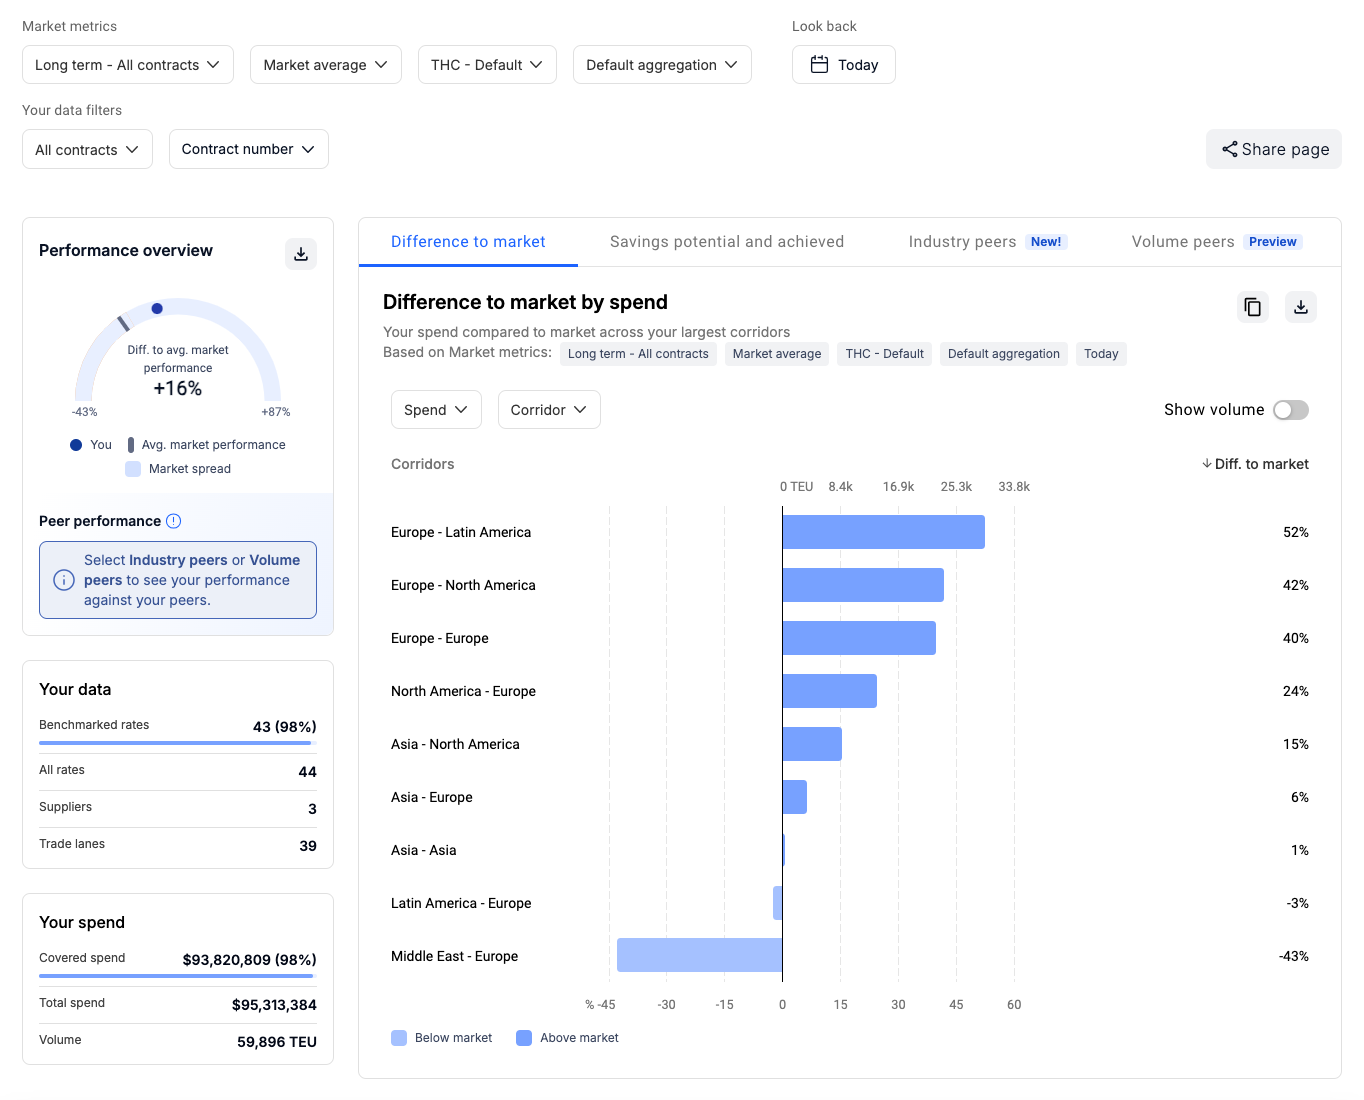
The page is divided into two distinct sections, where the left-hand side provides a summary of your performance, your data, and your spend, while the larger section on the right shows a more detailed breakdown of how you compare to the market across specific corridors, trade lanes, and market segments.
Performance summary
Your performance
The gauge under Your performance indicates the overall market spread between the company with the lowest and highest rates and shows your position within the market, across all corridors and companies, regardless of your contracted corridors.
If you switch to Industry peers or Volume peers, the gauge will also highlight the performance of your peers. For more information, see Peer comparison.
Your data
Your data shows a summary of your rate data available in Xeneta.
- Benchmarked rates — proportion of your valid and non-expired rates that Xeneta can compare to the market
If we are unable to benchmark any of your rates due to limited coverage or other issues, they will not be factored into the Benchmarked rates figure.
- All rates — total number of individual rates found in your data
- Suppliers — total number of individual suppliers (or carriers) found in your data
- Trade lanes — total number of unique port-to-port trade lanes found in your data
Your spend
Your spend shows a summary of your spend data available in Xeneta.
- Covered spend — proportion of your total spend that Xeneta can benchmark against the market
- Total spend — total amount spent on your volume (amount paid multiplied by number of TEUs)
- Volume — total number of TEUs found in your uploaded data (valid and non-expired)
Performance breakdown
This section of Performance overview breaks down how you compare to the market in terms of rates and spend, highlights any potential and achieved savings, and shows how you're performing relative to your peers.
The performance chart is interactive, and clicking on an individual line will take you to the respective Spend or Rates benchmarks page with more details. Some chart views also allow you to display volume data by using the Show volume toggle.
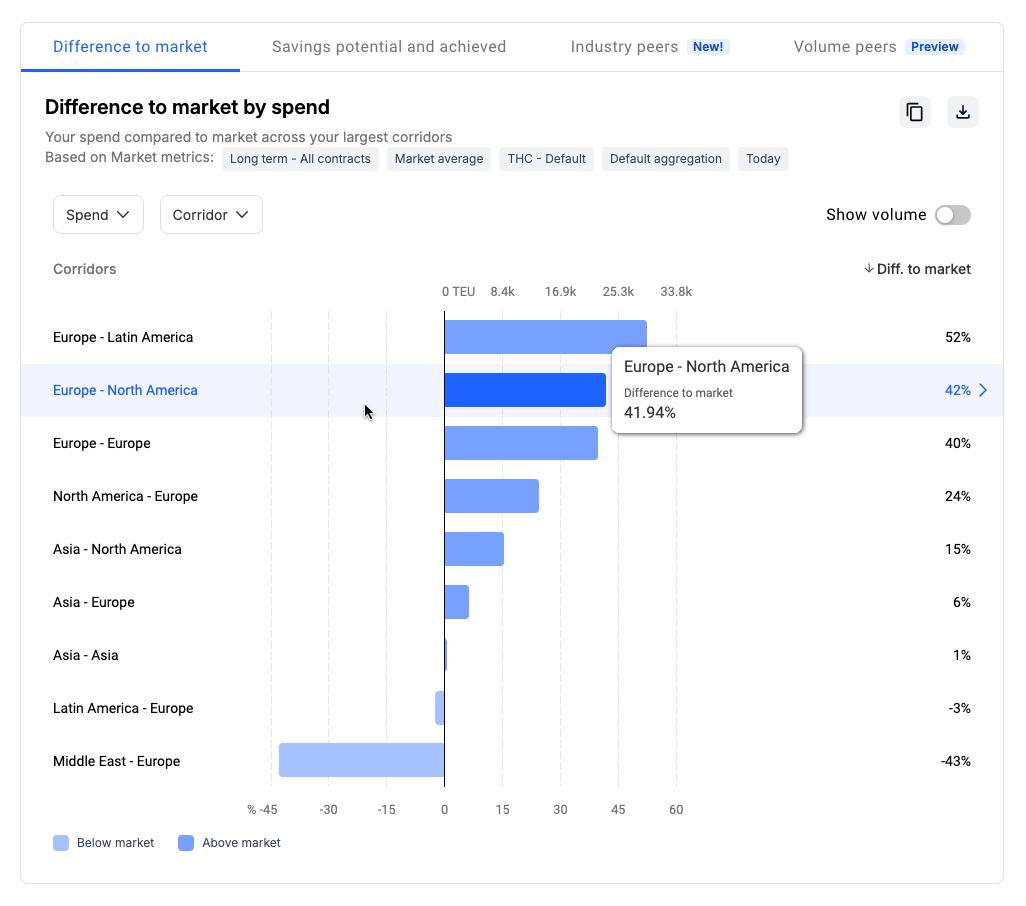
Difference to market
The Difference tab shows how your rates or spend compare to the rest of the market globally or across the largest corridors:
Savings potential and achieved
The Savings tab highlights your total potential and achieved savings across different market segments, either globally or by corridor, trade lane, or supplier.
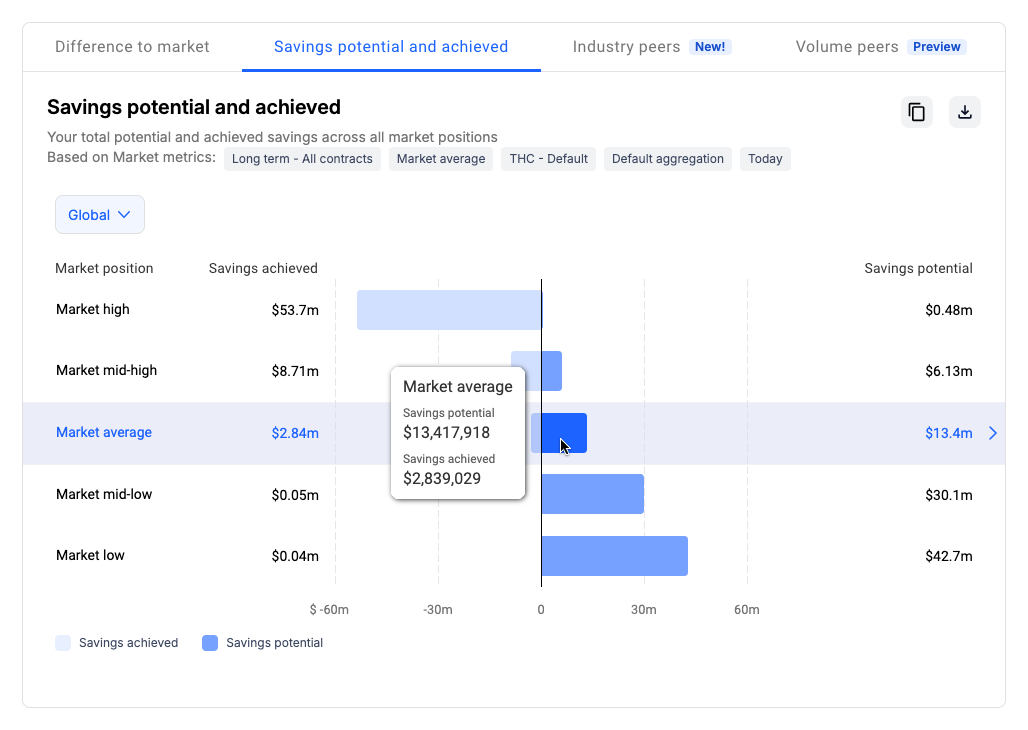
The difference between these two indicators is that Savings potential highlights the amount you could possibly save if your contracted rates were more aligned with the selected market segment, while Savings achieved shows how much you have already saved compared to the market based on your current contracted rates.
Both are calculated using a simple mathematical formula, where a positive number indicates potential savings, while a negative one shows how much you have already saved:
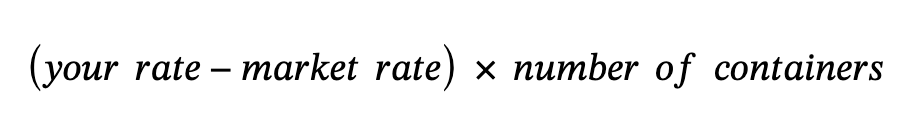
For example, if you're shipping 1,000 containers at the contracted rate of $1,600, and with the market average currently at $1,400, the result will show that you could potentially save up to $200,000 by renegotiating your rate closer to the market average level.
Peer comparison
The Industry peers and Volume peers tabs offer insight into how your spend performance relative to the market compares to that of your industry or volume peers across your largest corridors.
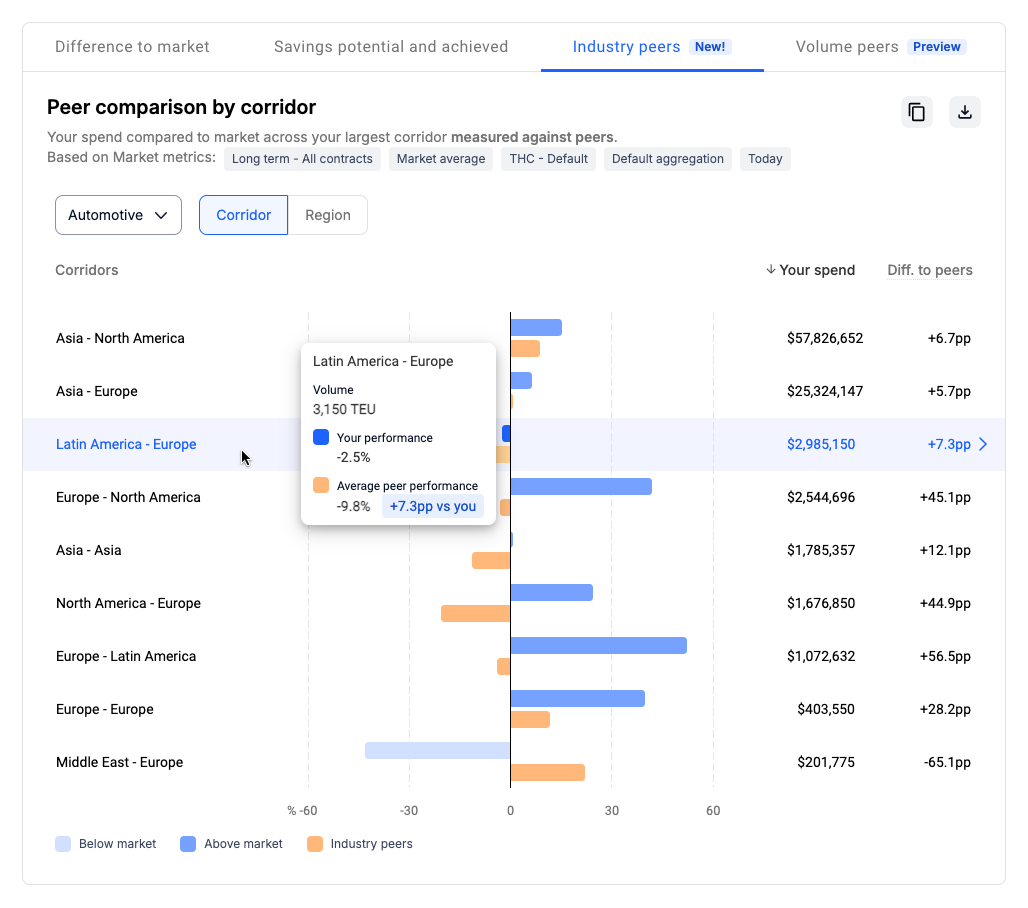
For a more detailed overview of how Peer comparison works, see Peer comparison.
Updated 4 months ago