Rate Adjustment Table
Rate details
The Rate Adjustments Table gives you a detailed, line-by-line breakdown of every cost component that makes up your freight rates covering origin, ocean, and destination charges.
Unlike the Rate Adjustments Graph, which highlights trends visually, the Rate Adjustments Table provides a comprehensive, tabular view over an extended period. Each column represents a specific timeframe (e.g., Jan 1 – Feb 28, 2025) with its original currency, allowing you to track how individual charges evolve over time.
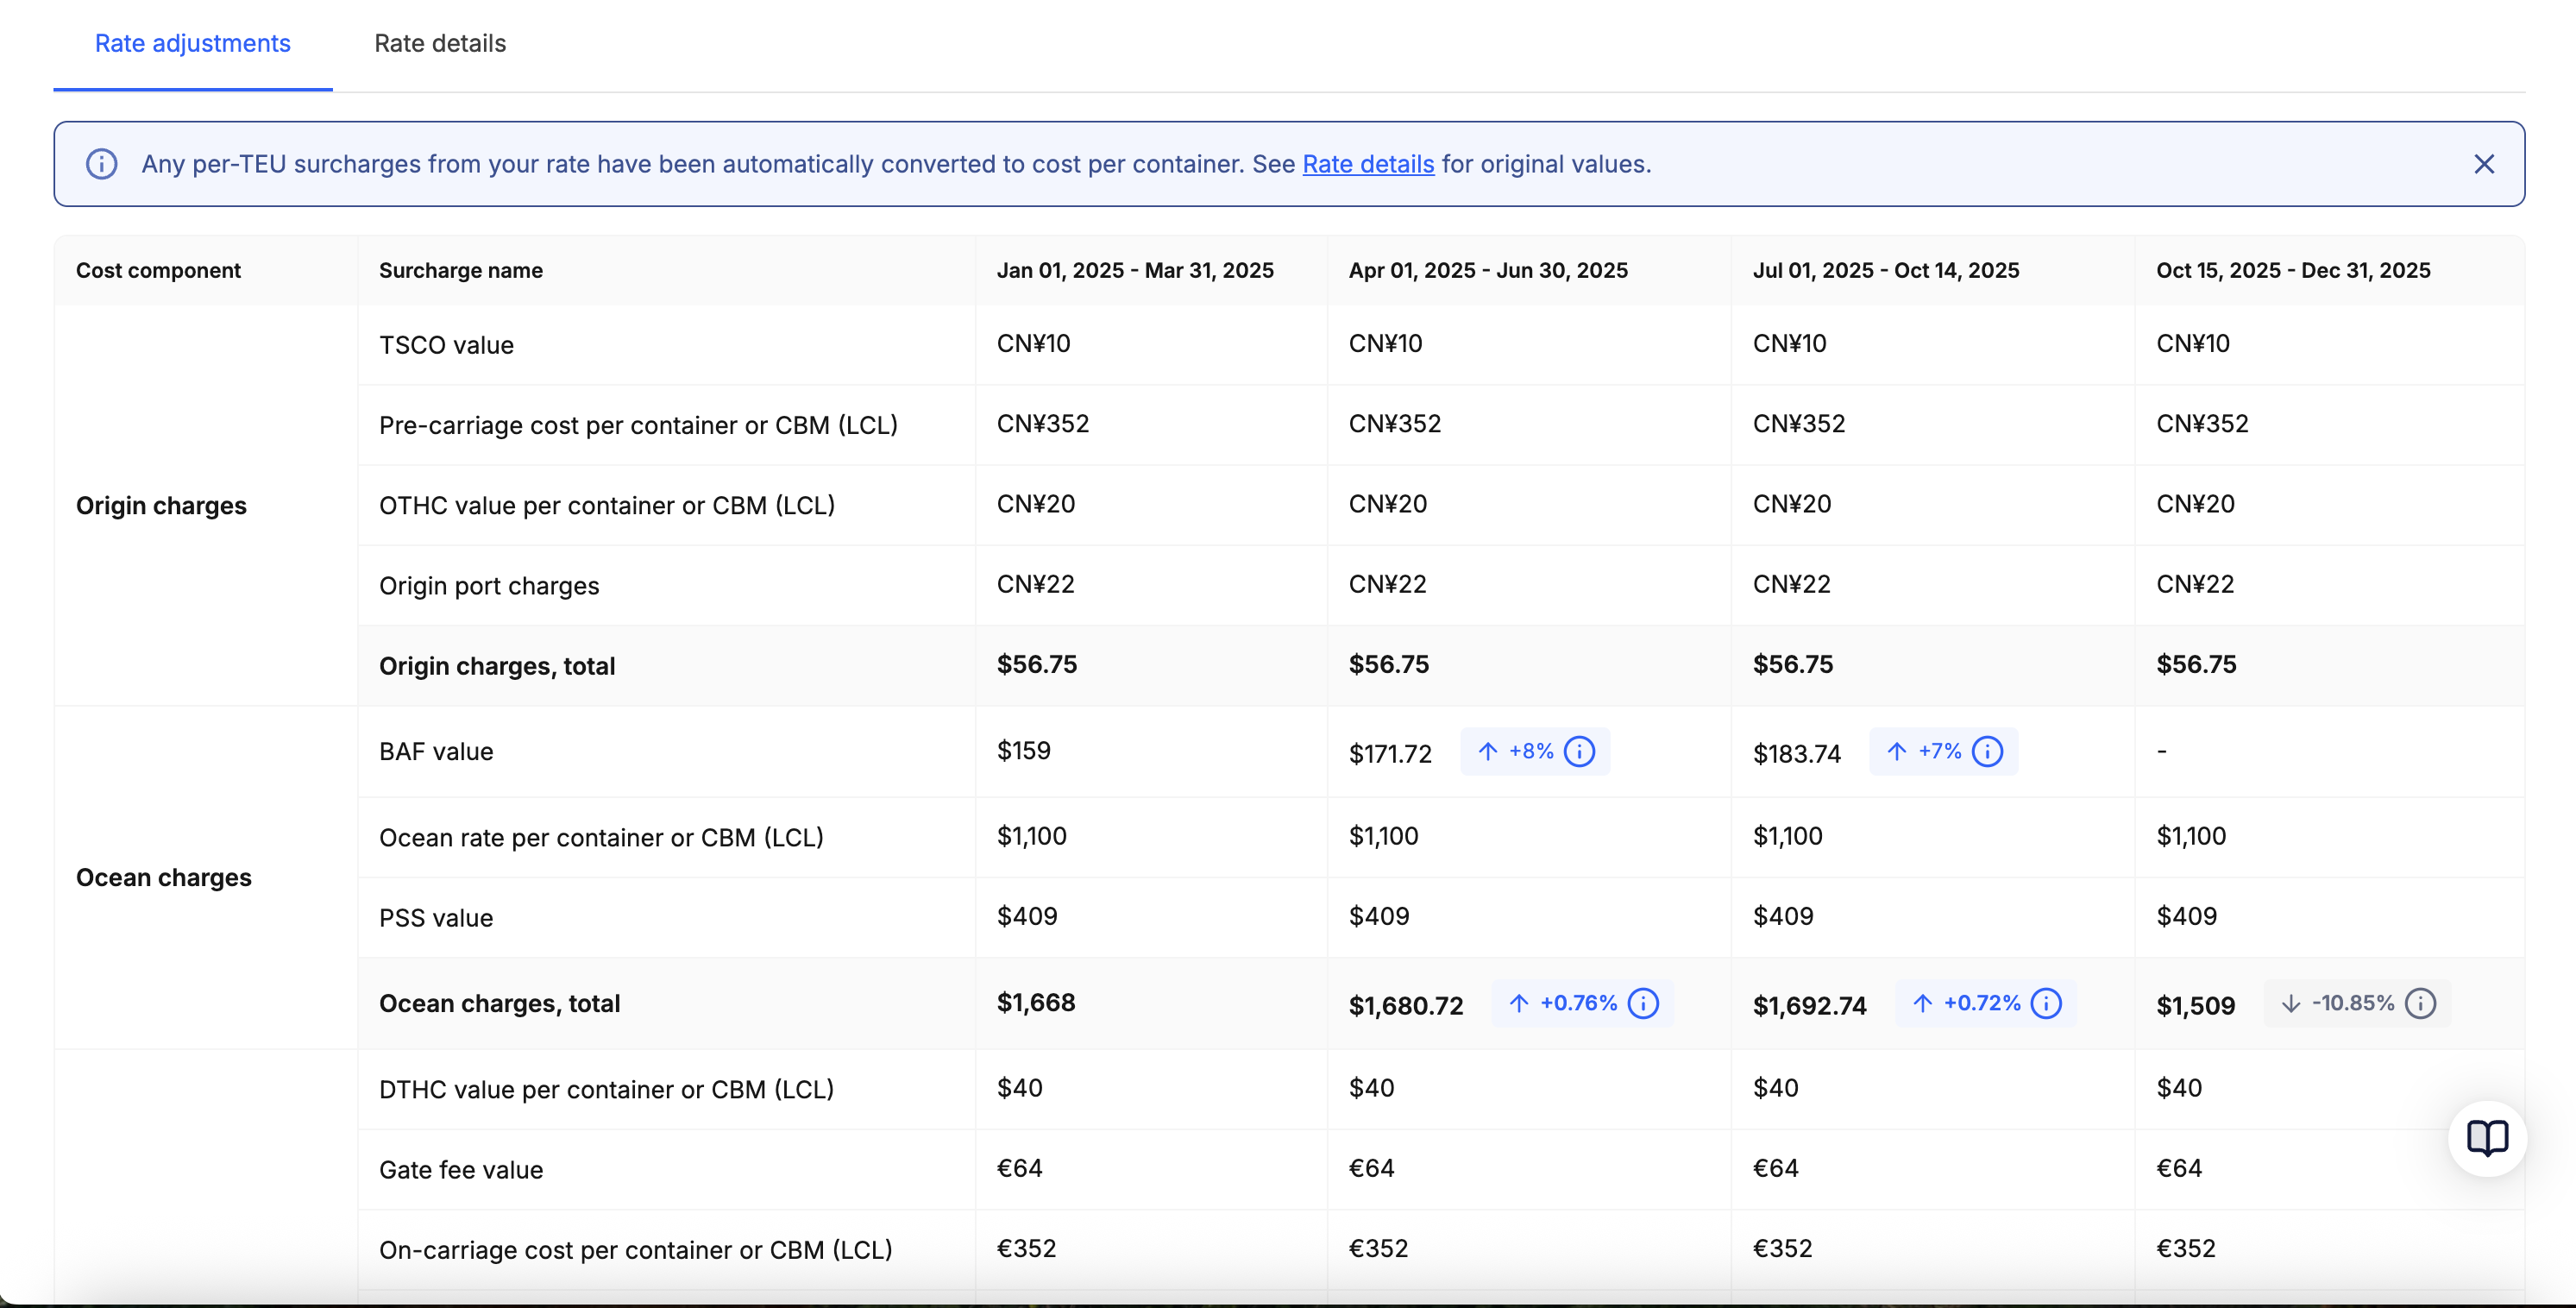
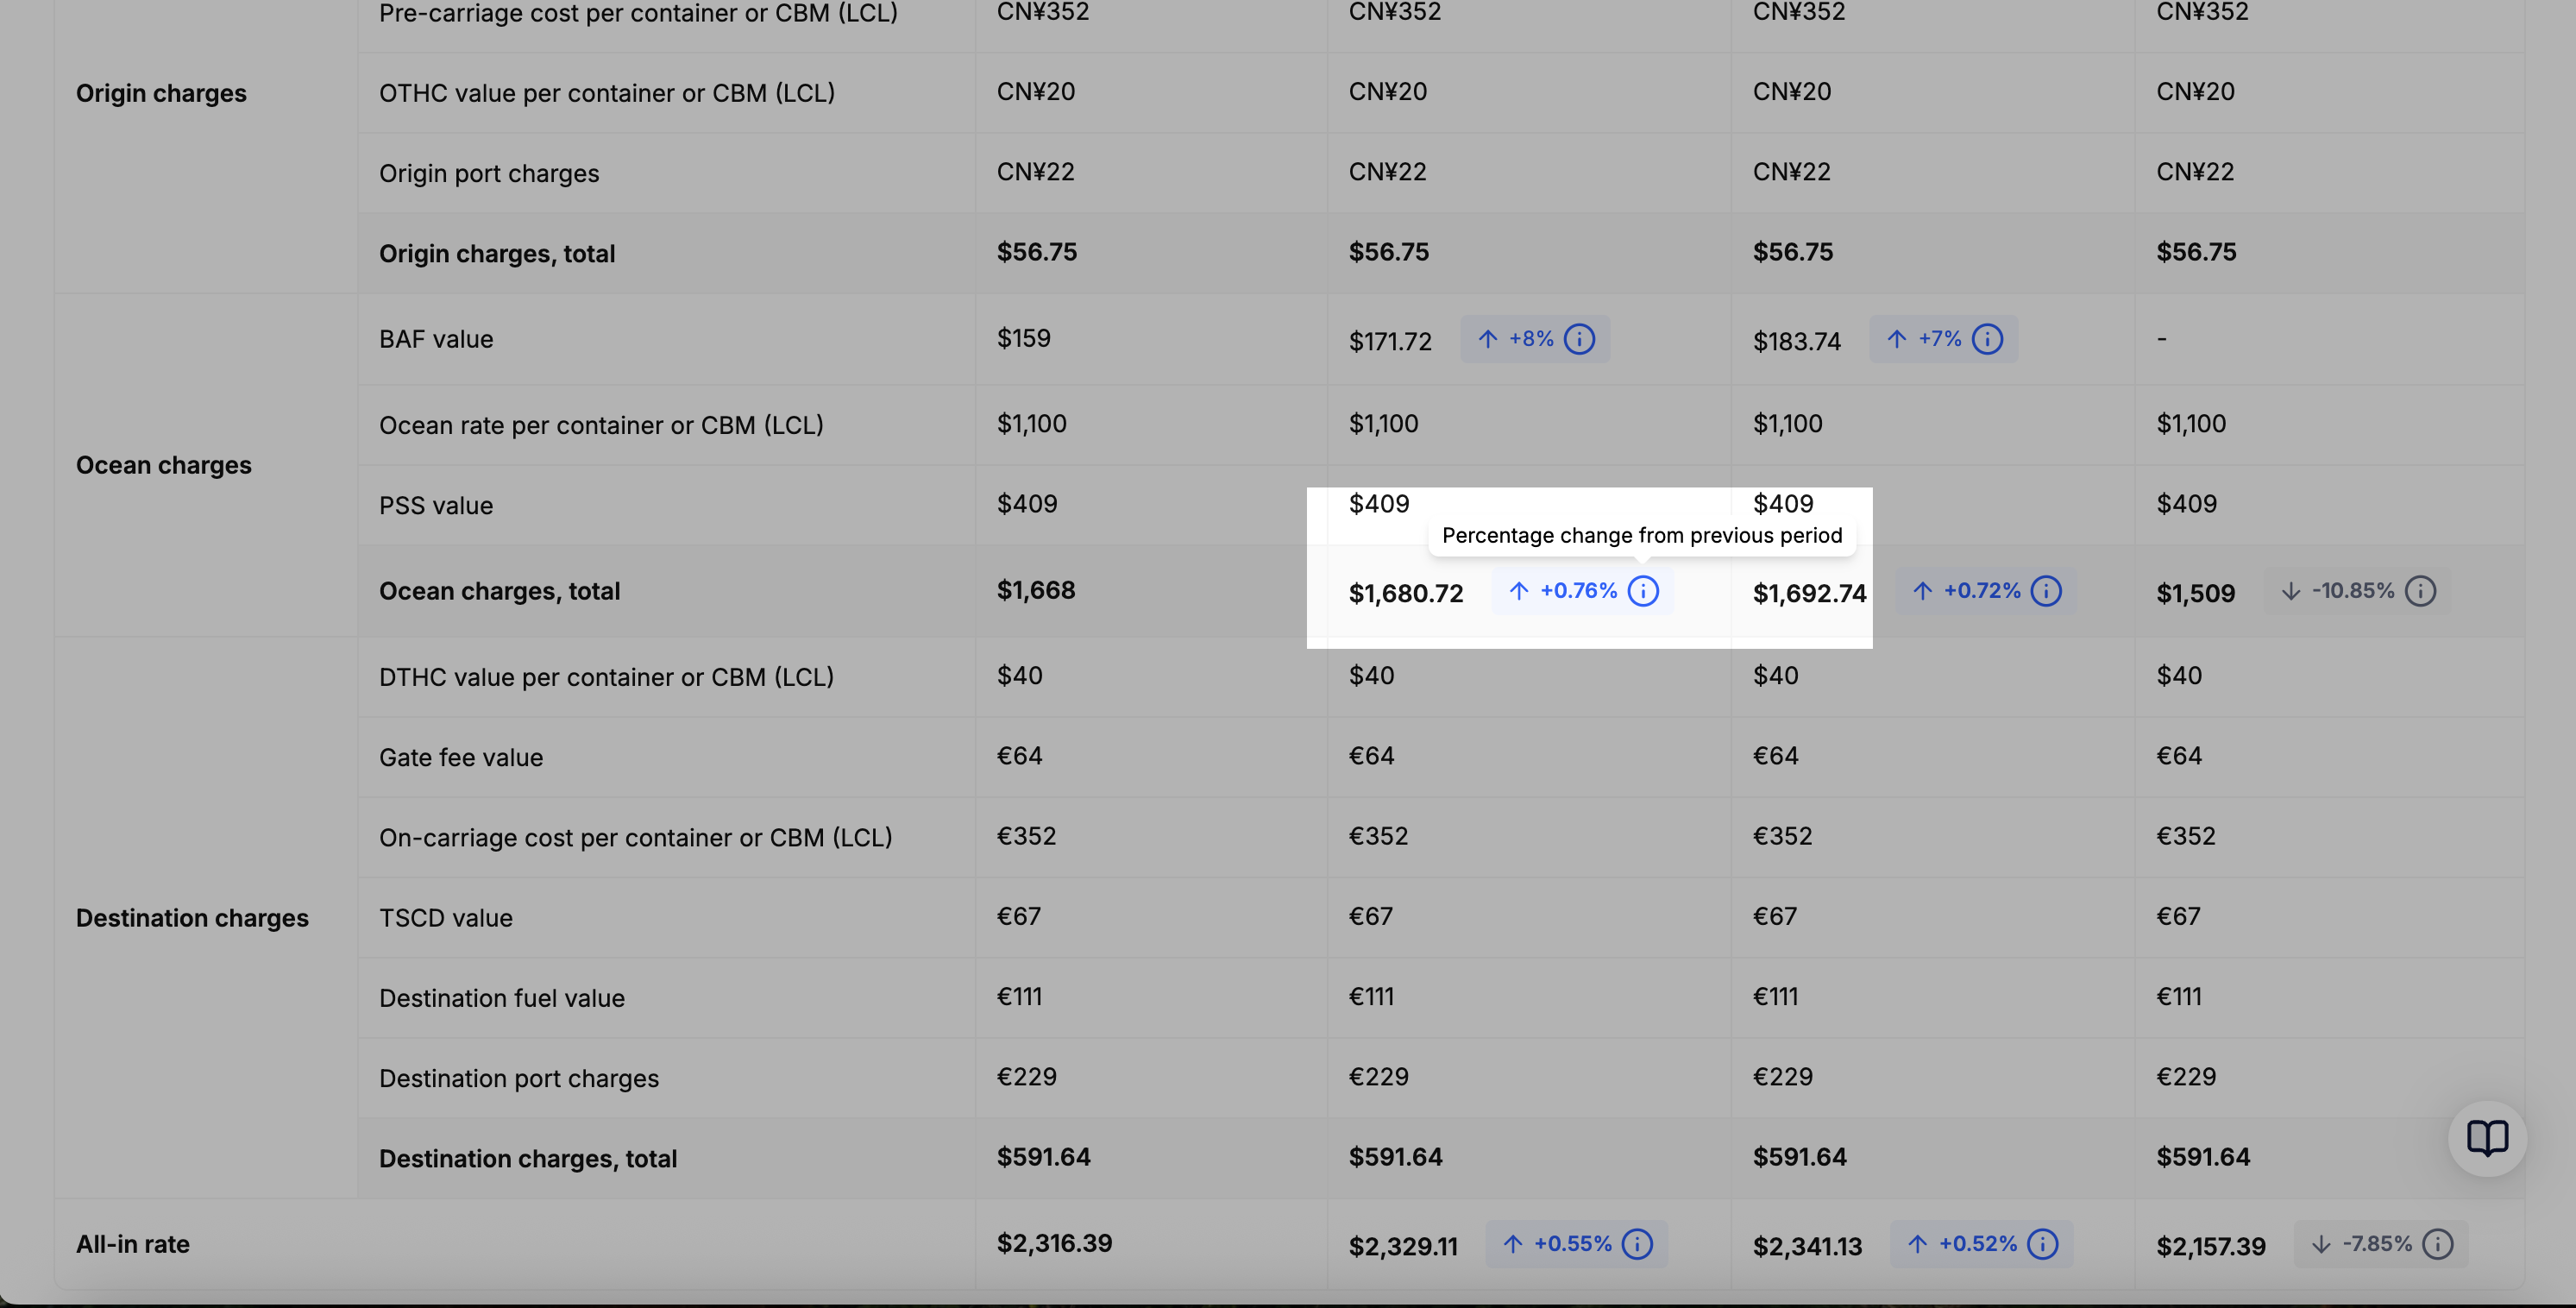
For certain charges, such as the peak season surcharge, the table also includes change indicators (e.g., -5% or +5%). These quick visual cues show whether your current rate is lower or higher than what you’ve previously paid, making it easy to spot where costs have risen or dropped.
Understanding currency conversion
The Rate Adjustments Table displays each surcharge with its original currency as uploaded. This is helpful for a number of teams, but particularly for finance to easily match invoice line items.
For example, seeing the exact amounts in EUR or CNY - ensuring full transparency and eliminating confusion from currency conversion differences across multiple supplier invoices.
In summary
Use the Rate Adjustments Table to:
- Drill down into detailed charges behind your all-in rate and catch when suppliers shift costs
- Track changes over time with clear, structured visibility without relying on messy spreadsheets
- Spot cost increases or savings instantly with easy-to-read percentage indicators
Updated 5 months ago