Carbon emissions
Carbon emissions is a one of the datasets available on the Market benchmarks page that provides an indexed view of the ocean carriers' CO2 emissions and allows you to see how they change and develop over time on the largest trade corridors.
The index is based on real data provided by an independent analytics firm Marine Benchmark and is updated every quarter with no input from carriers.
View emissions data
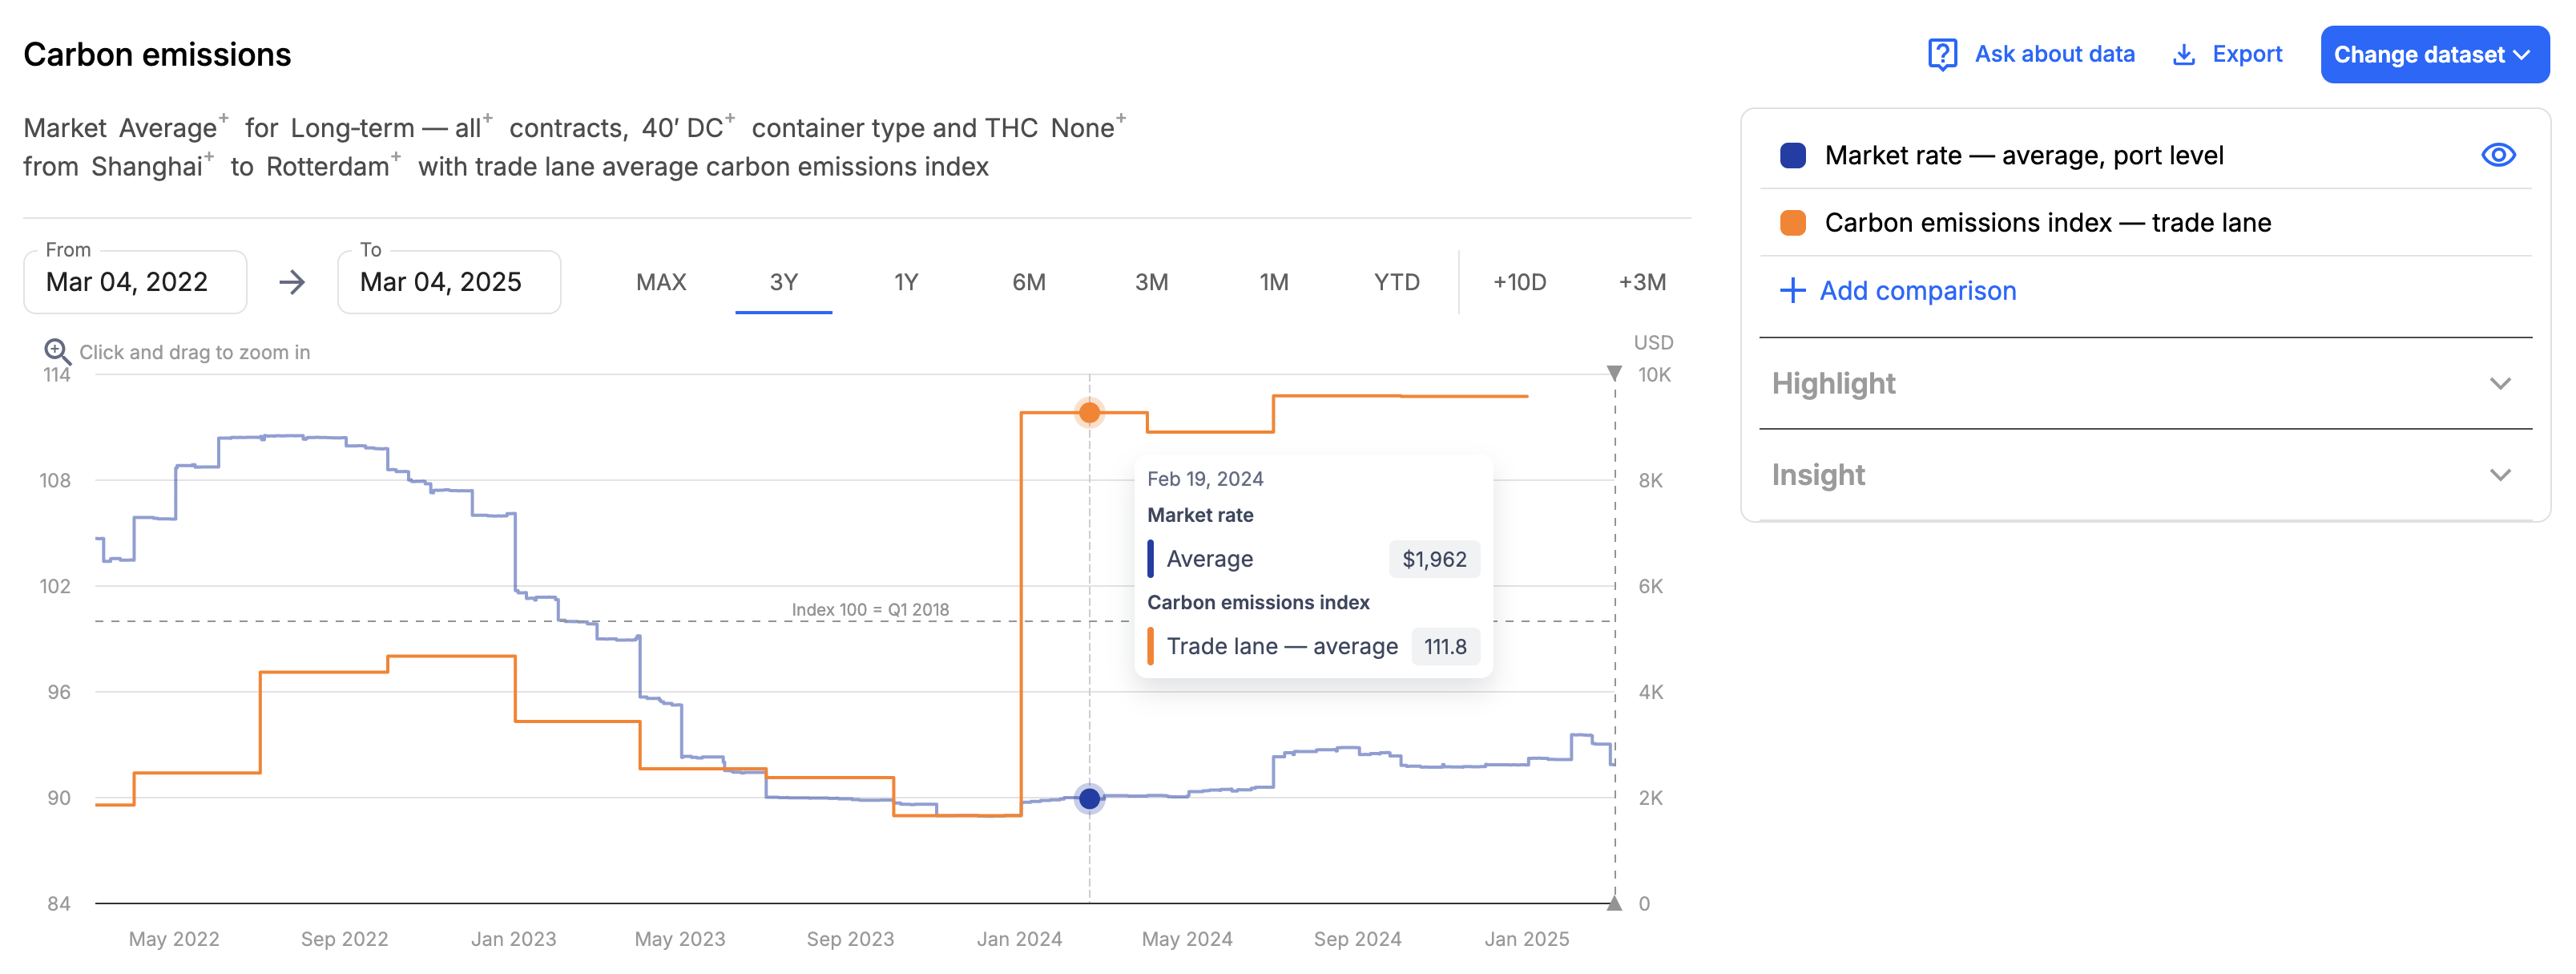
To access the carbon emissions data, go to Market benchmarks and select Carbon emissions in the Change dataset menu — the graph with market rates for the selected origin and destination will be updated with the average index value for carbon emissions:
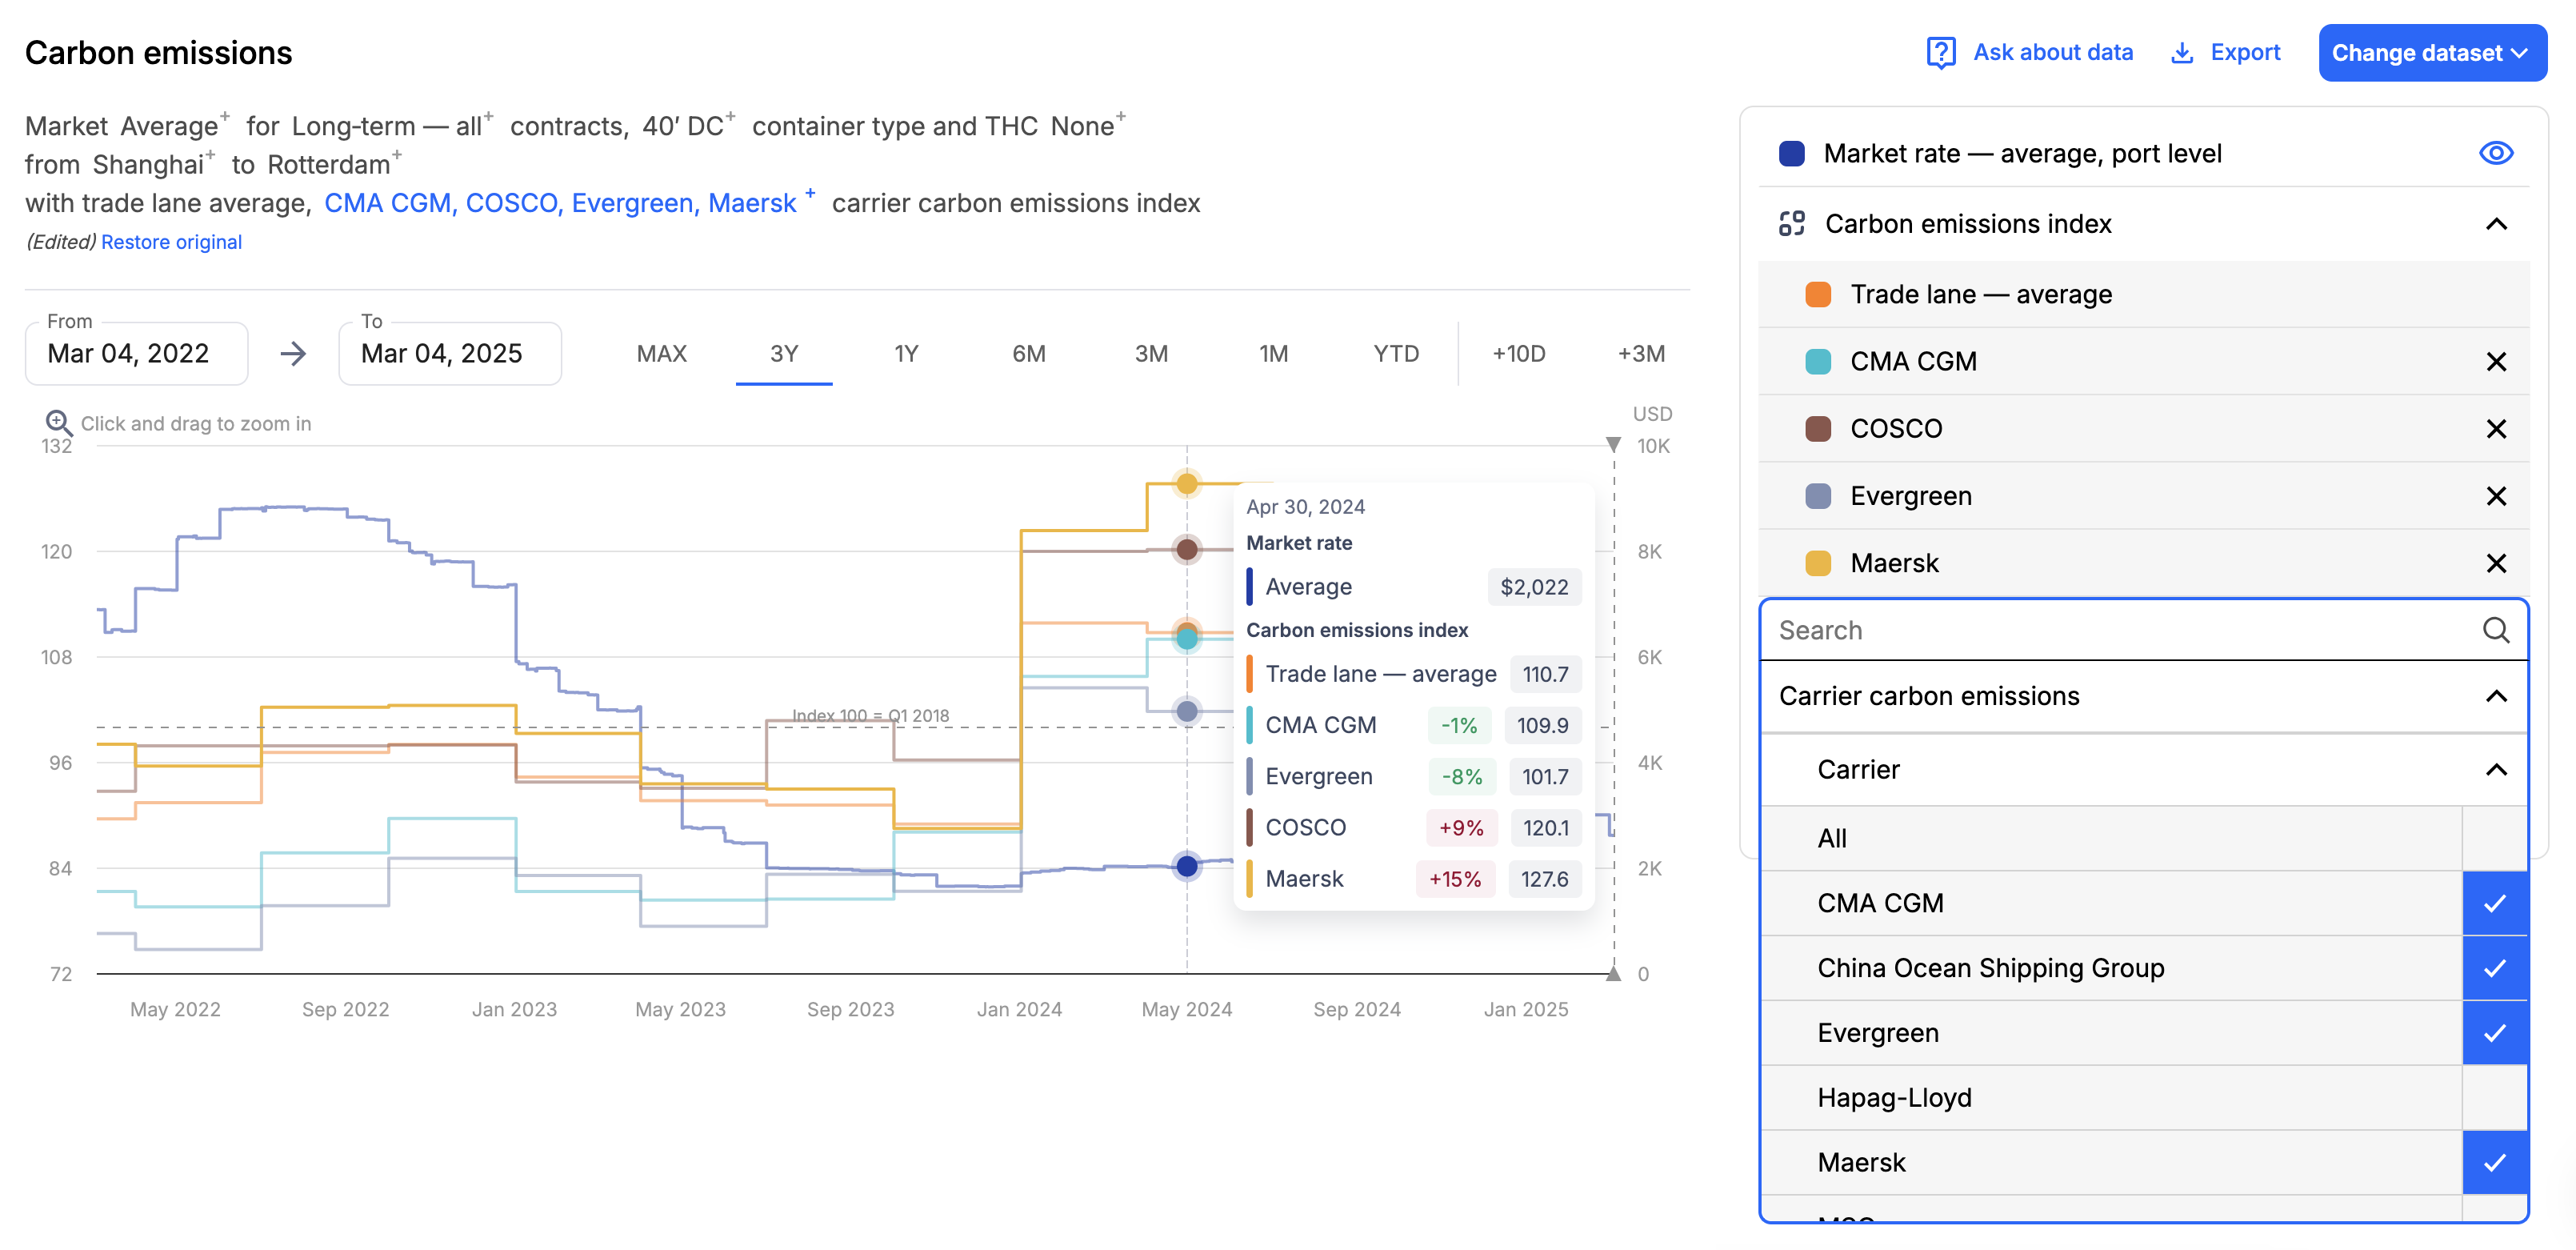
If you want to evaluate individual carrier performance, click Add comparison to the right of the graph, and then go to Carrier carbon emissions > Carrier to add specific carriers to the graph:
How to read the index
The index is based on the average CO2 emissions by the largest carriers operating on the given trade lane within a specific quarter.
The index values are based on actual CO2 per ton calculations, which are then mapped to our geo-hierarchy and indexed to the trade lane average for Q1 2018.
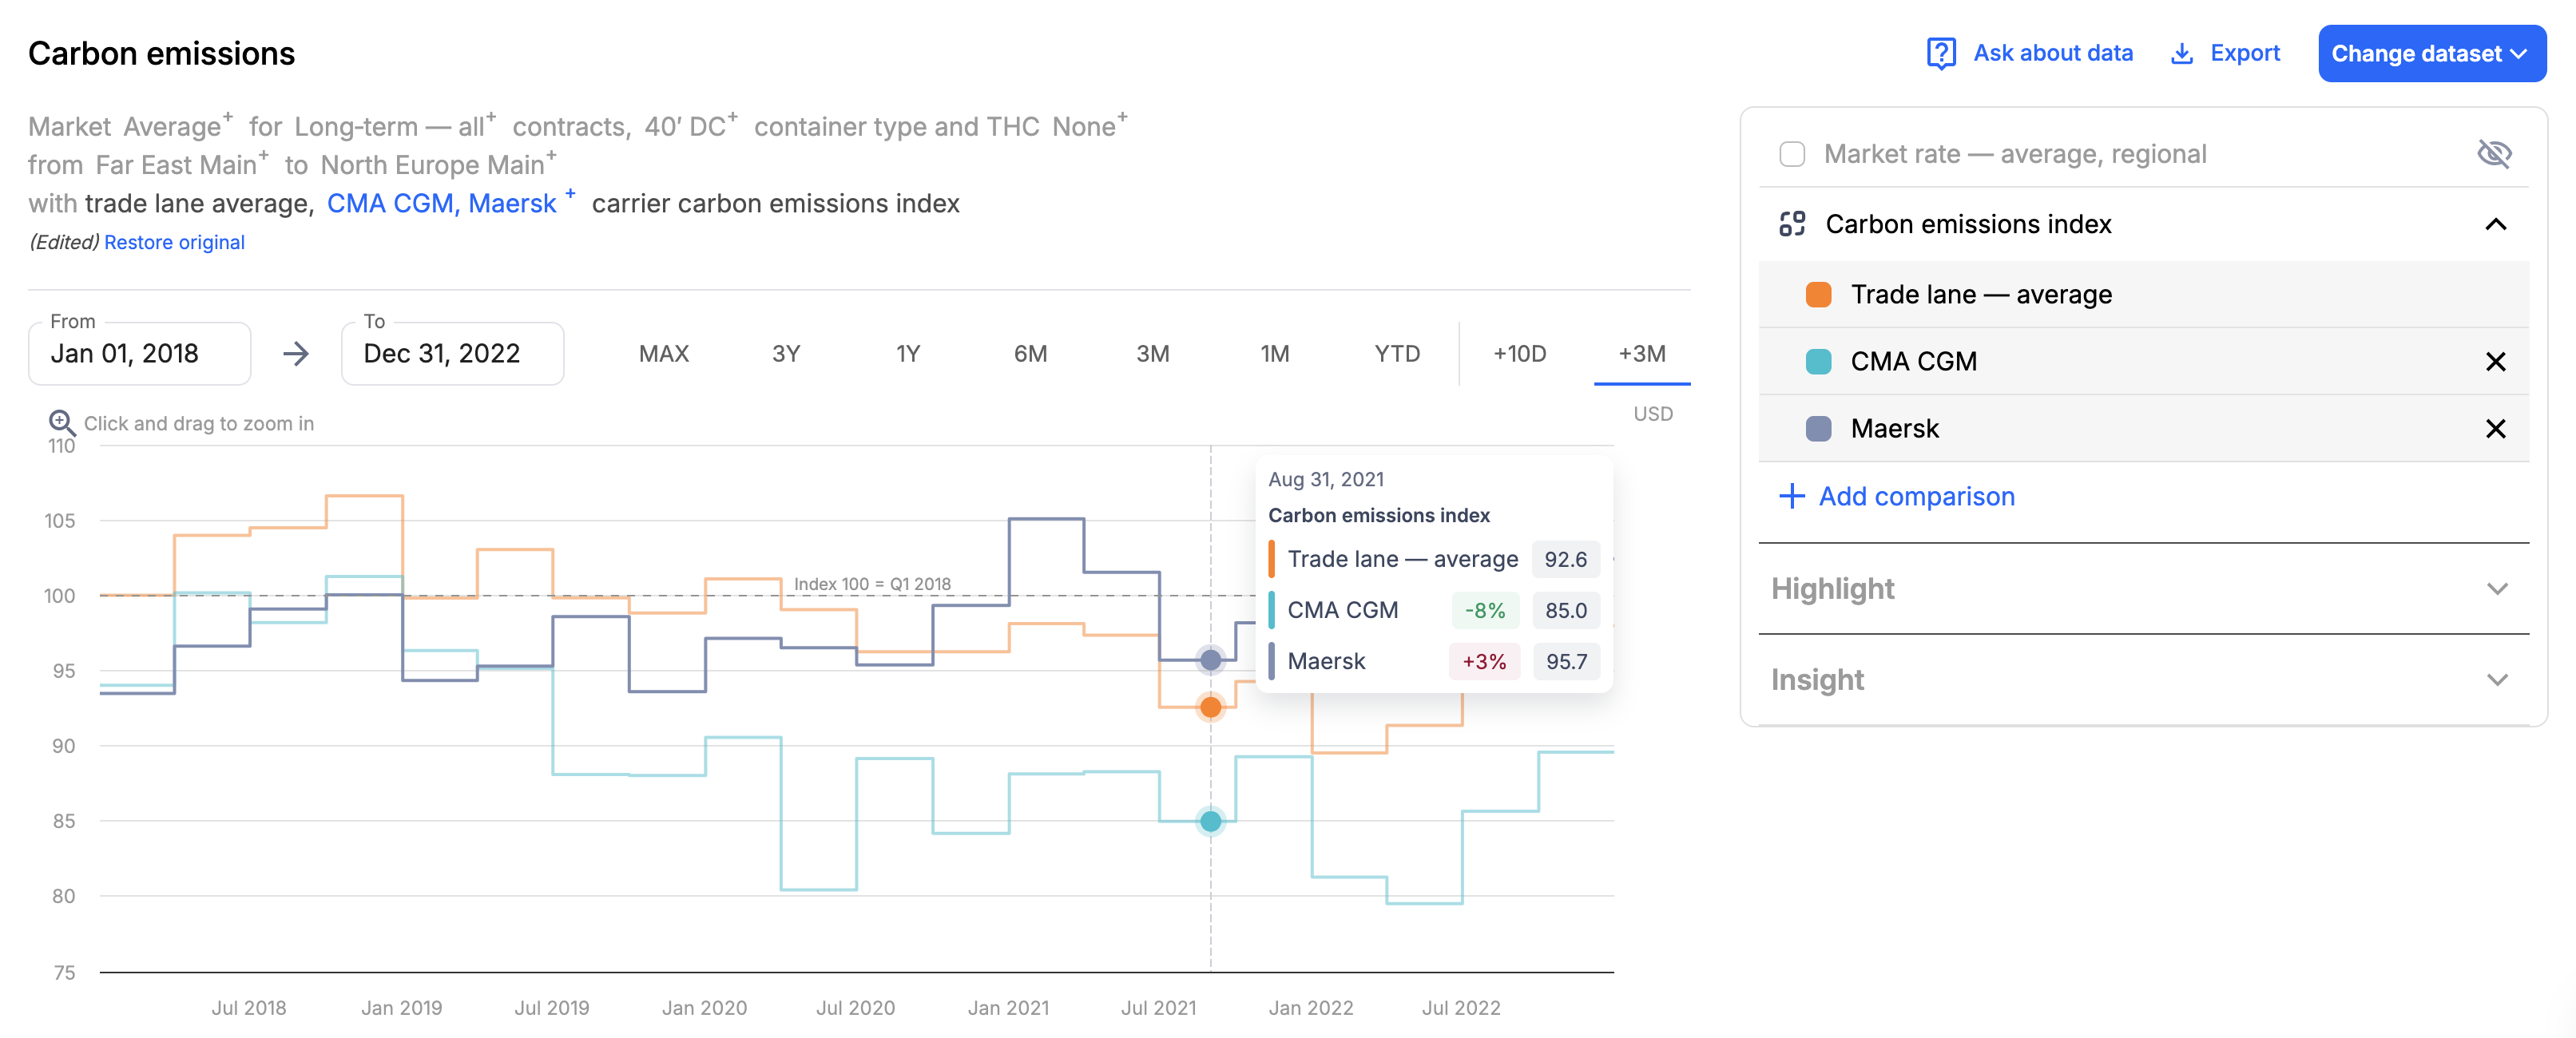
Carbon emissions trend on Far East – North Europe with CMA CGM and Maersk
Looking at the example above, we can see that out of the two carriers we selected, only CMA CGM performed consistently below average with a clear trend towards reducing their emissions on the Far East to North Europe trade corridor within the selected period.
At the same time, Maersk's performance was more inconsistent, with a noticeable jump above the average value towards the end of 2022.
The index is primarily intended to help you make more informed and environmentally conscious procurement decisions, and is not meant to be used as a carbon accounting tool.
Updated 4 months ago