Tender performance analysis
Performance analysis is a feature available in our Tender benchmark tool that allows you to get a quick breakdown of your tender performance in terms of rates and spend when compared to the market on the corridor or trade lane level.
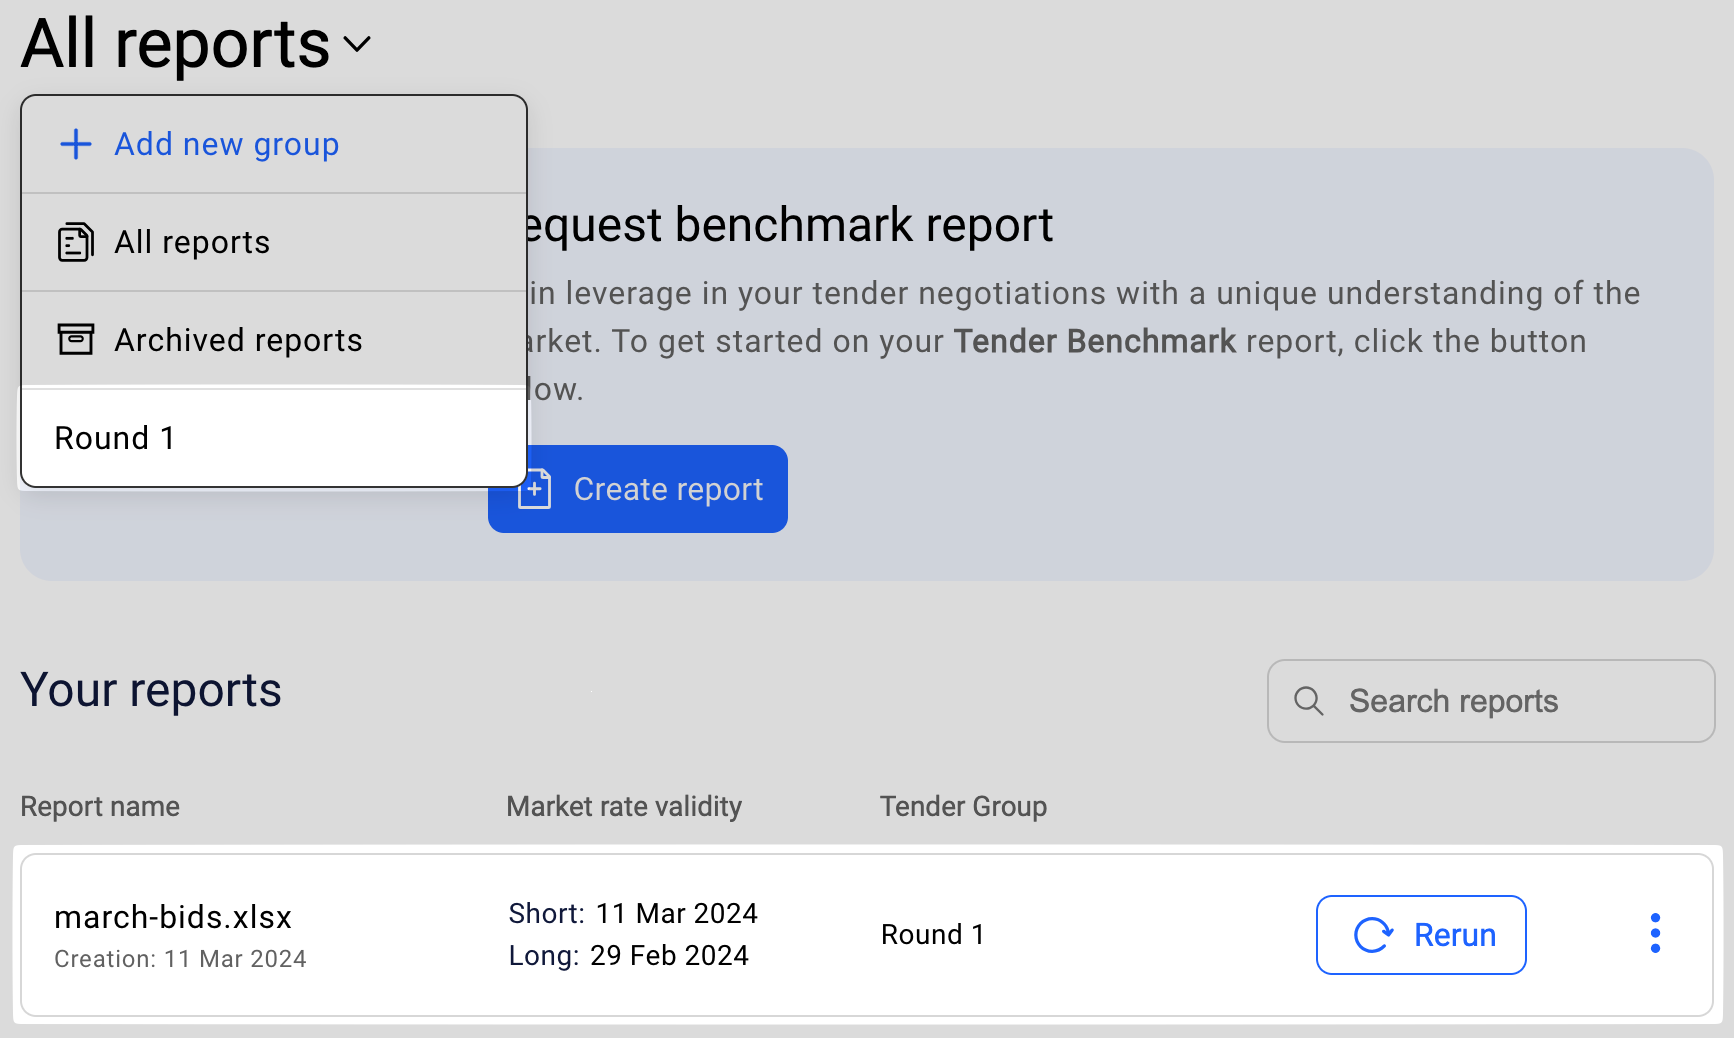
To access performance analysis, select a specific group or an individual report:
Rate analysis
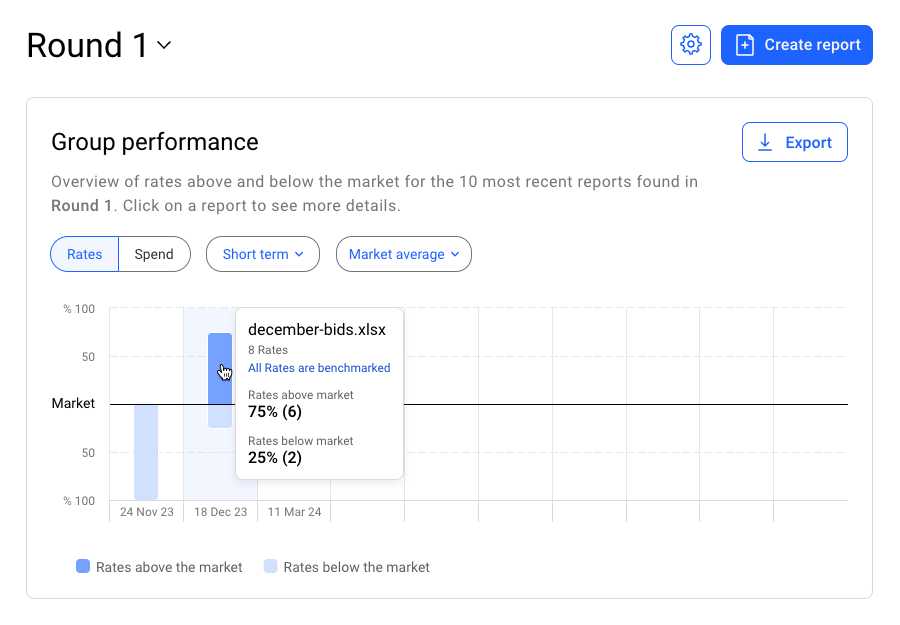
Rate analysis is the default view when you select a report to analyze — it shows you your tender rate performance on the group level, with a simple breakdown of your rates above and below the market for each individual report:
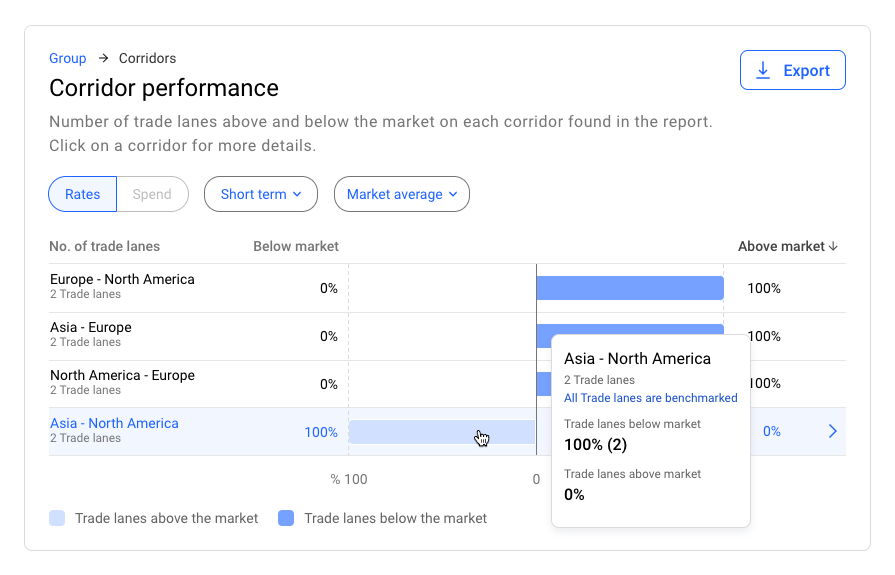
Clicking on a specific report on the chart will allow to drill down to your performance on the corridor level:
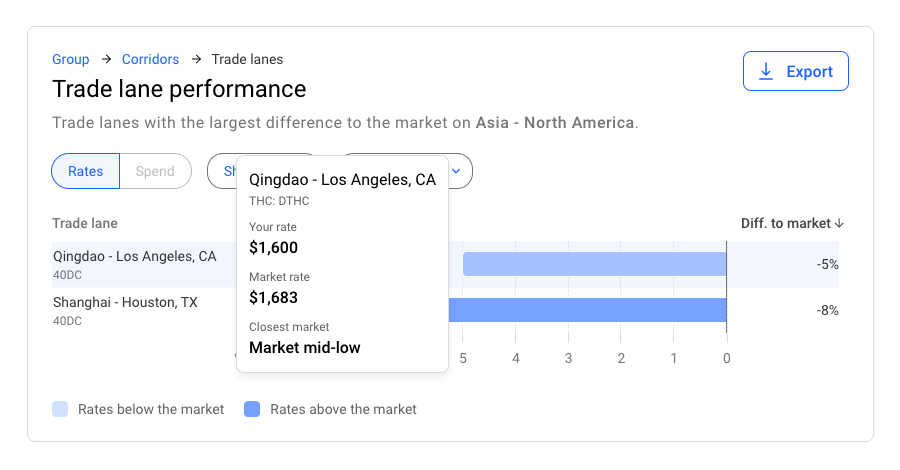
Clicking on a corridor will take you to the most granular level that displays your tender rate performance across all trade lanes found in that corridor:
Spend analysis
Spend analysis shows you how your tender spend compares to what the market is paying for the same volumes.
Spend analysis needs volume information — be sure to include it with your uploaded bid sheets if you want to access this feature.
To switch to the spend analysis view, click the Spend button just above the chart:
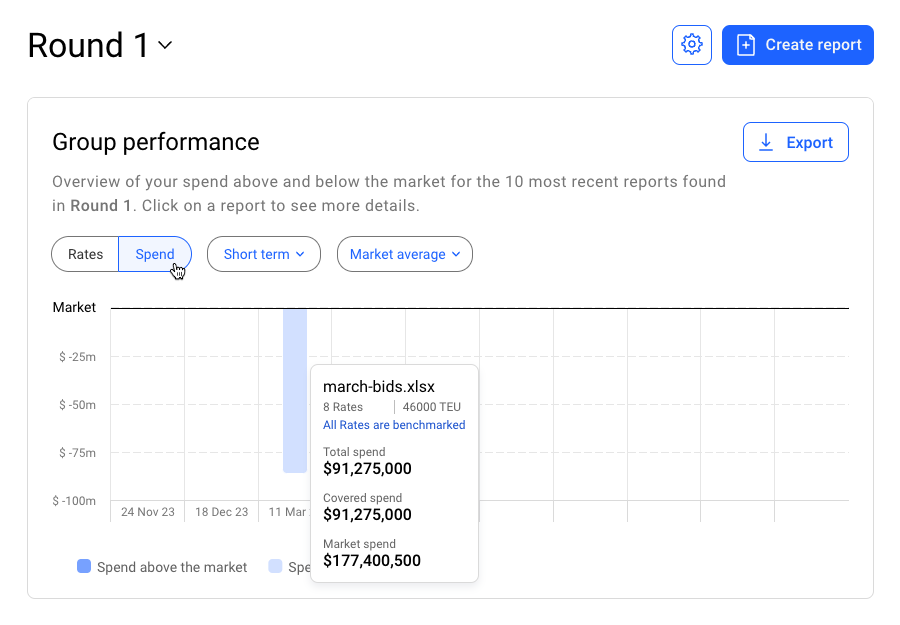
You'll see a general summary of your spend data across all trade lanes found in the selected report (or corridor):
- Total spend — your volumes multiplied by bid rates
- Covered spend — amount of your total spend that Xeneta can reliably benchmark with comparable market rates
- Market spend — your volumes multiplied by market rates within the selected market position
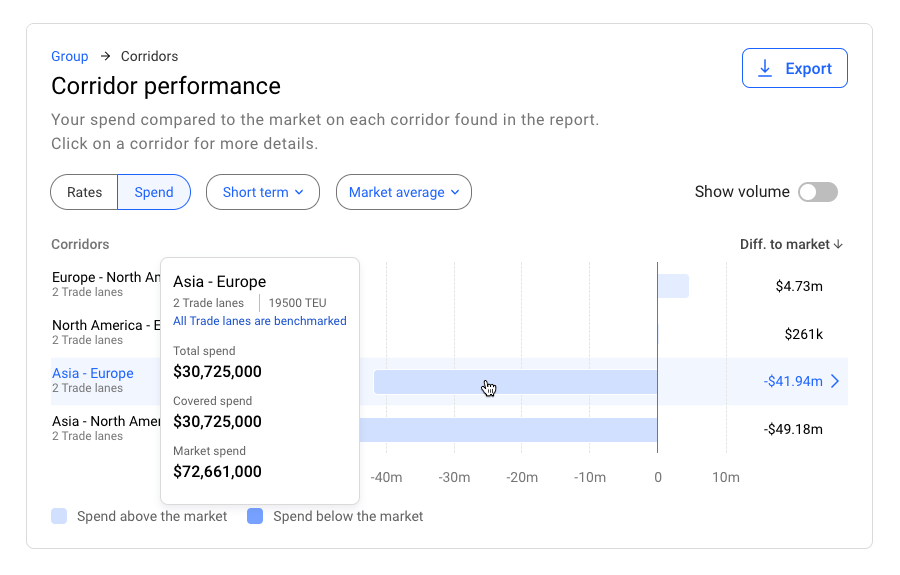
To drill down and review your spend performance on the corridor or trade lane level, click on a specific report on the chart:
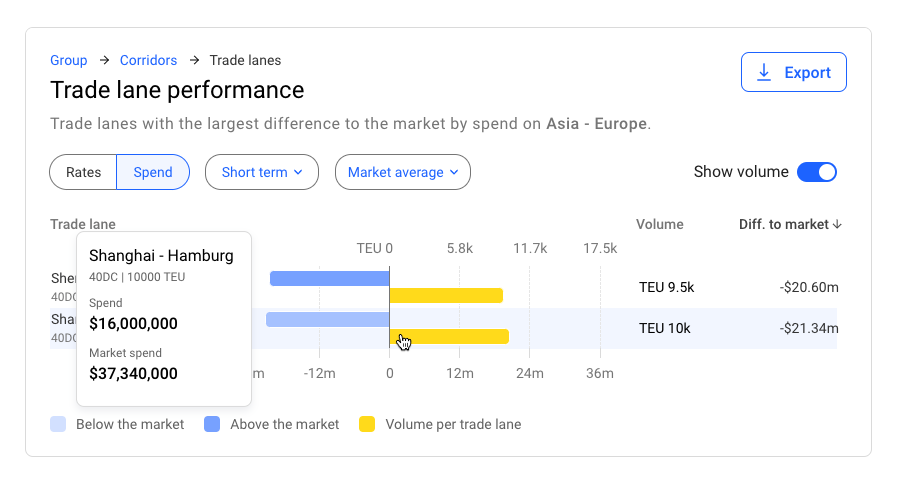
Click the Show volume toggle to see your volume data alongside your spend:
Updated 4 months ago