How to use Price benchmarks
This quick guide will walk you through the Price benchmarks page and show you how you can get an in-depth look into the air rates you have provided to Xeneta to see how they stack up against the rest of the market.
Step 1. Go to Price benchmarks
Go to Price benchmarks from the Analyze section of the navigation menu.
You'll find yourself on the Corridors tab that lists all of your uploaded rates grouped by larger trade corridors:
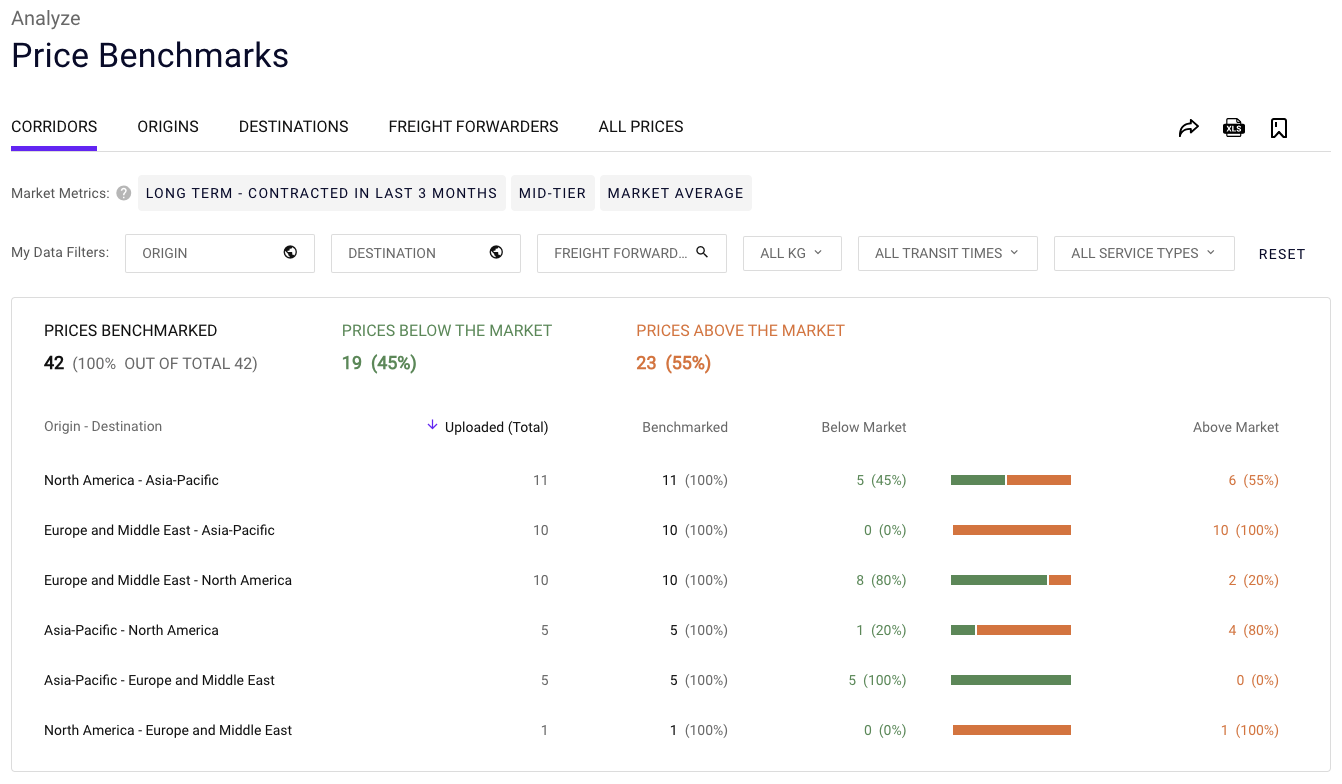
The table columns will show:
- Total number of uploaded rates
- Percentage of those rates that Xeneta can benchmark (or compare to the market)
- Number of your rates below the selected market position
- Number of your rates above the selected market position
Step 2. Review all freight forwarder rates
Switch to the Freight forwarders tab to see how your rates compare to the market based on the different suppliers that they come from:
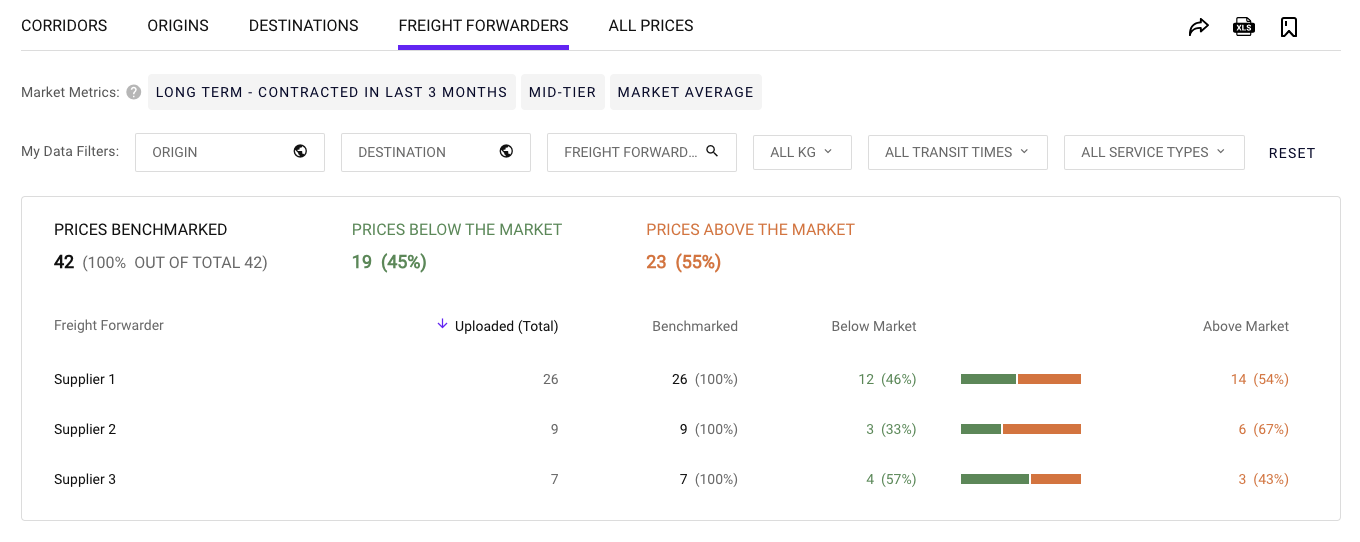
Don't forget to adjust the Market metrics to make sure that you're comparing your rates to the relevant segment of the market.
We see that 67% of all rates provided by Supplier 2 are above the market — let's take a closer look.
Using the other available tabs you can look at how your rates perform relative to the market based on their origin or destination.
Step 3. Drill down into freight forwarder rates
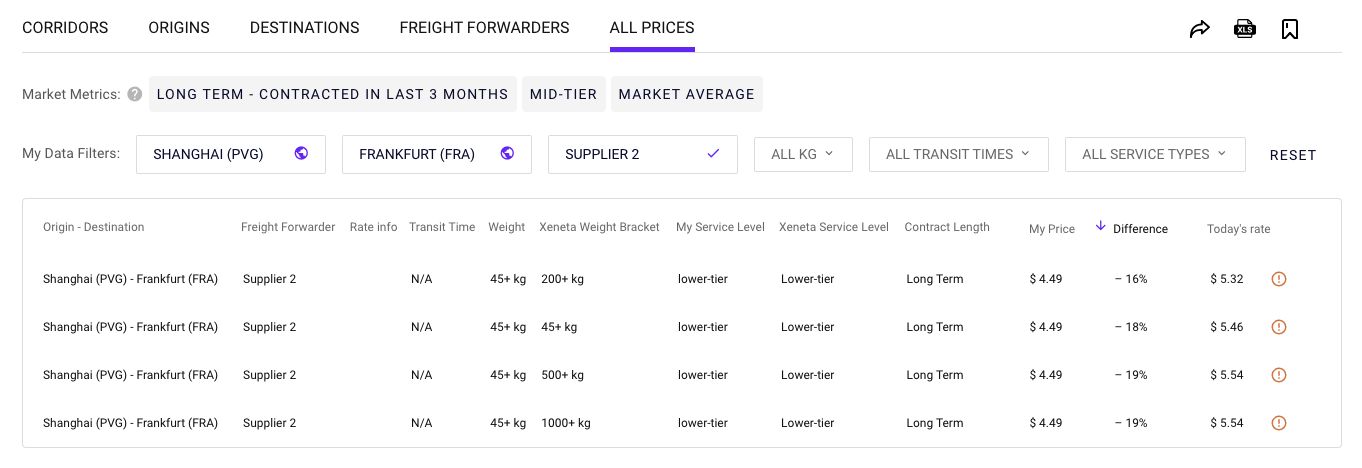
Click on the line with your selected freight forwarder to go to the All prices tab and see a detailed breakdown of their rates by individual port pair, weight category, service level and other attributes:
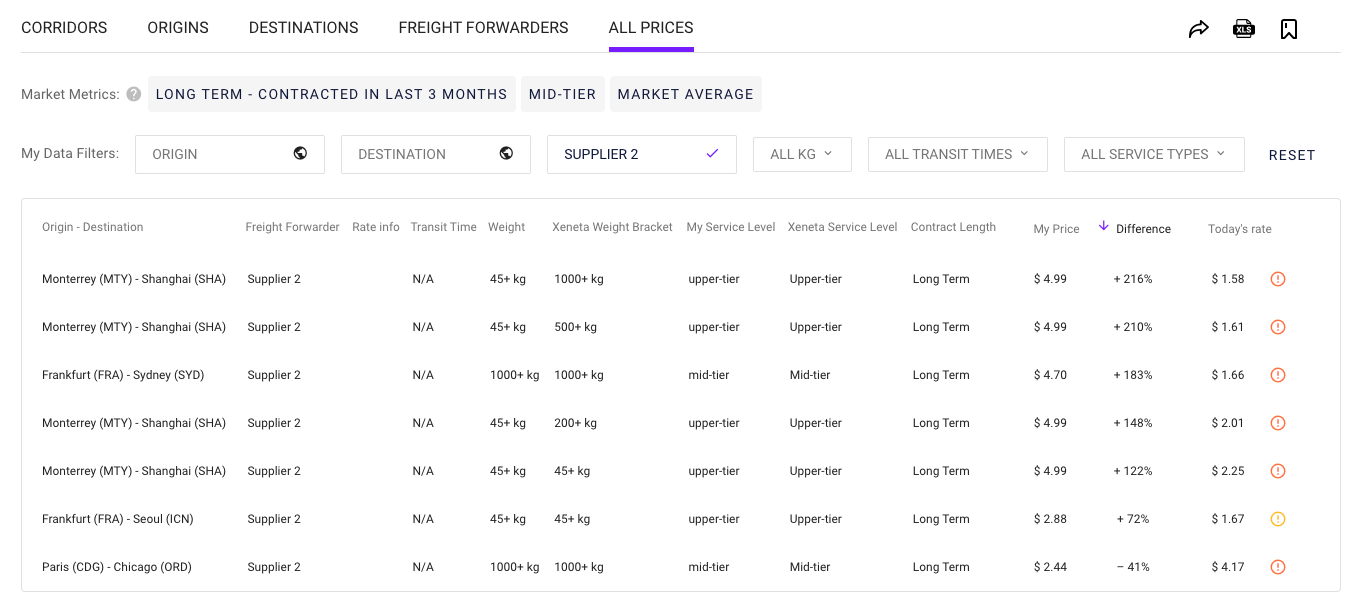
Use the available sorting and filter options to narrow down and identify specific trade lanes where the rates offered by this supplier deviate from the market the most:
Updated 4 months ago