Market benchmarks
The Market benchmarks page provides a comprehensive view of the ocean freight market dynamics and offers a number of tools to help you stay informed about the current direction of the market across multiple dimensions — from rates to capacity, reliability, and other types of data.
Using Market benchmarks, you can:
- Search and look up market data for a specific origin-destination pair
- View a detailed chart with market trends across multiple types of data
- Organize your trade lanes into custom watchlists to keep track of any changes
- Access highlights and insights with relevant data-driven commentary
Search trade lanes
To search for a specific trade lane or corridor, use the search section located at the top of the page:

Enter the Origin and Destination locations using the respective fields — they can be a specific port or a broader region. As you start typing, the system will automatically suggest the most relevant locations based on your input.
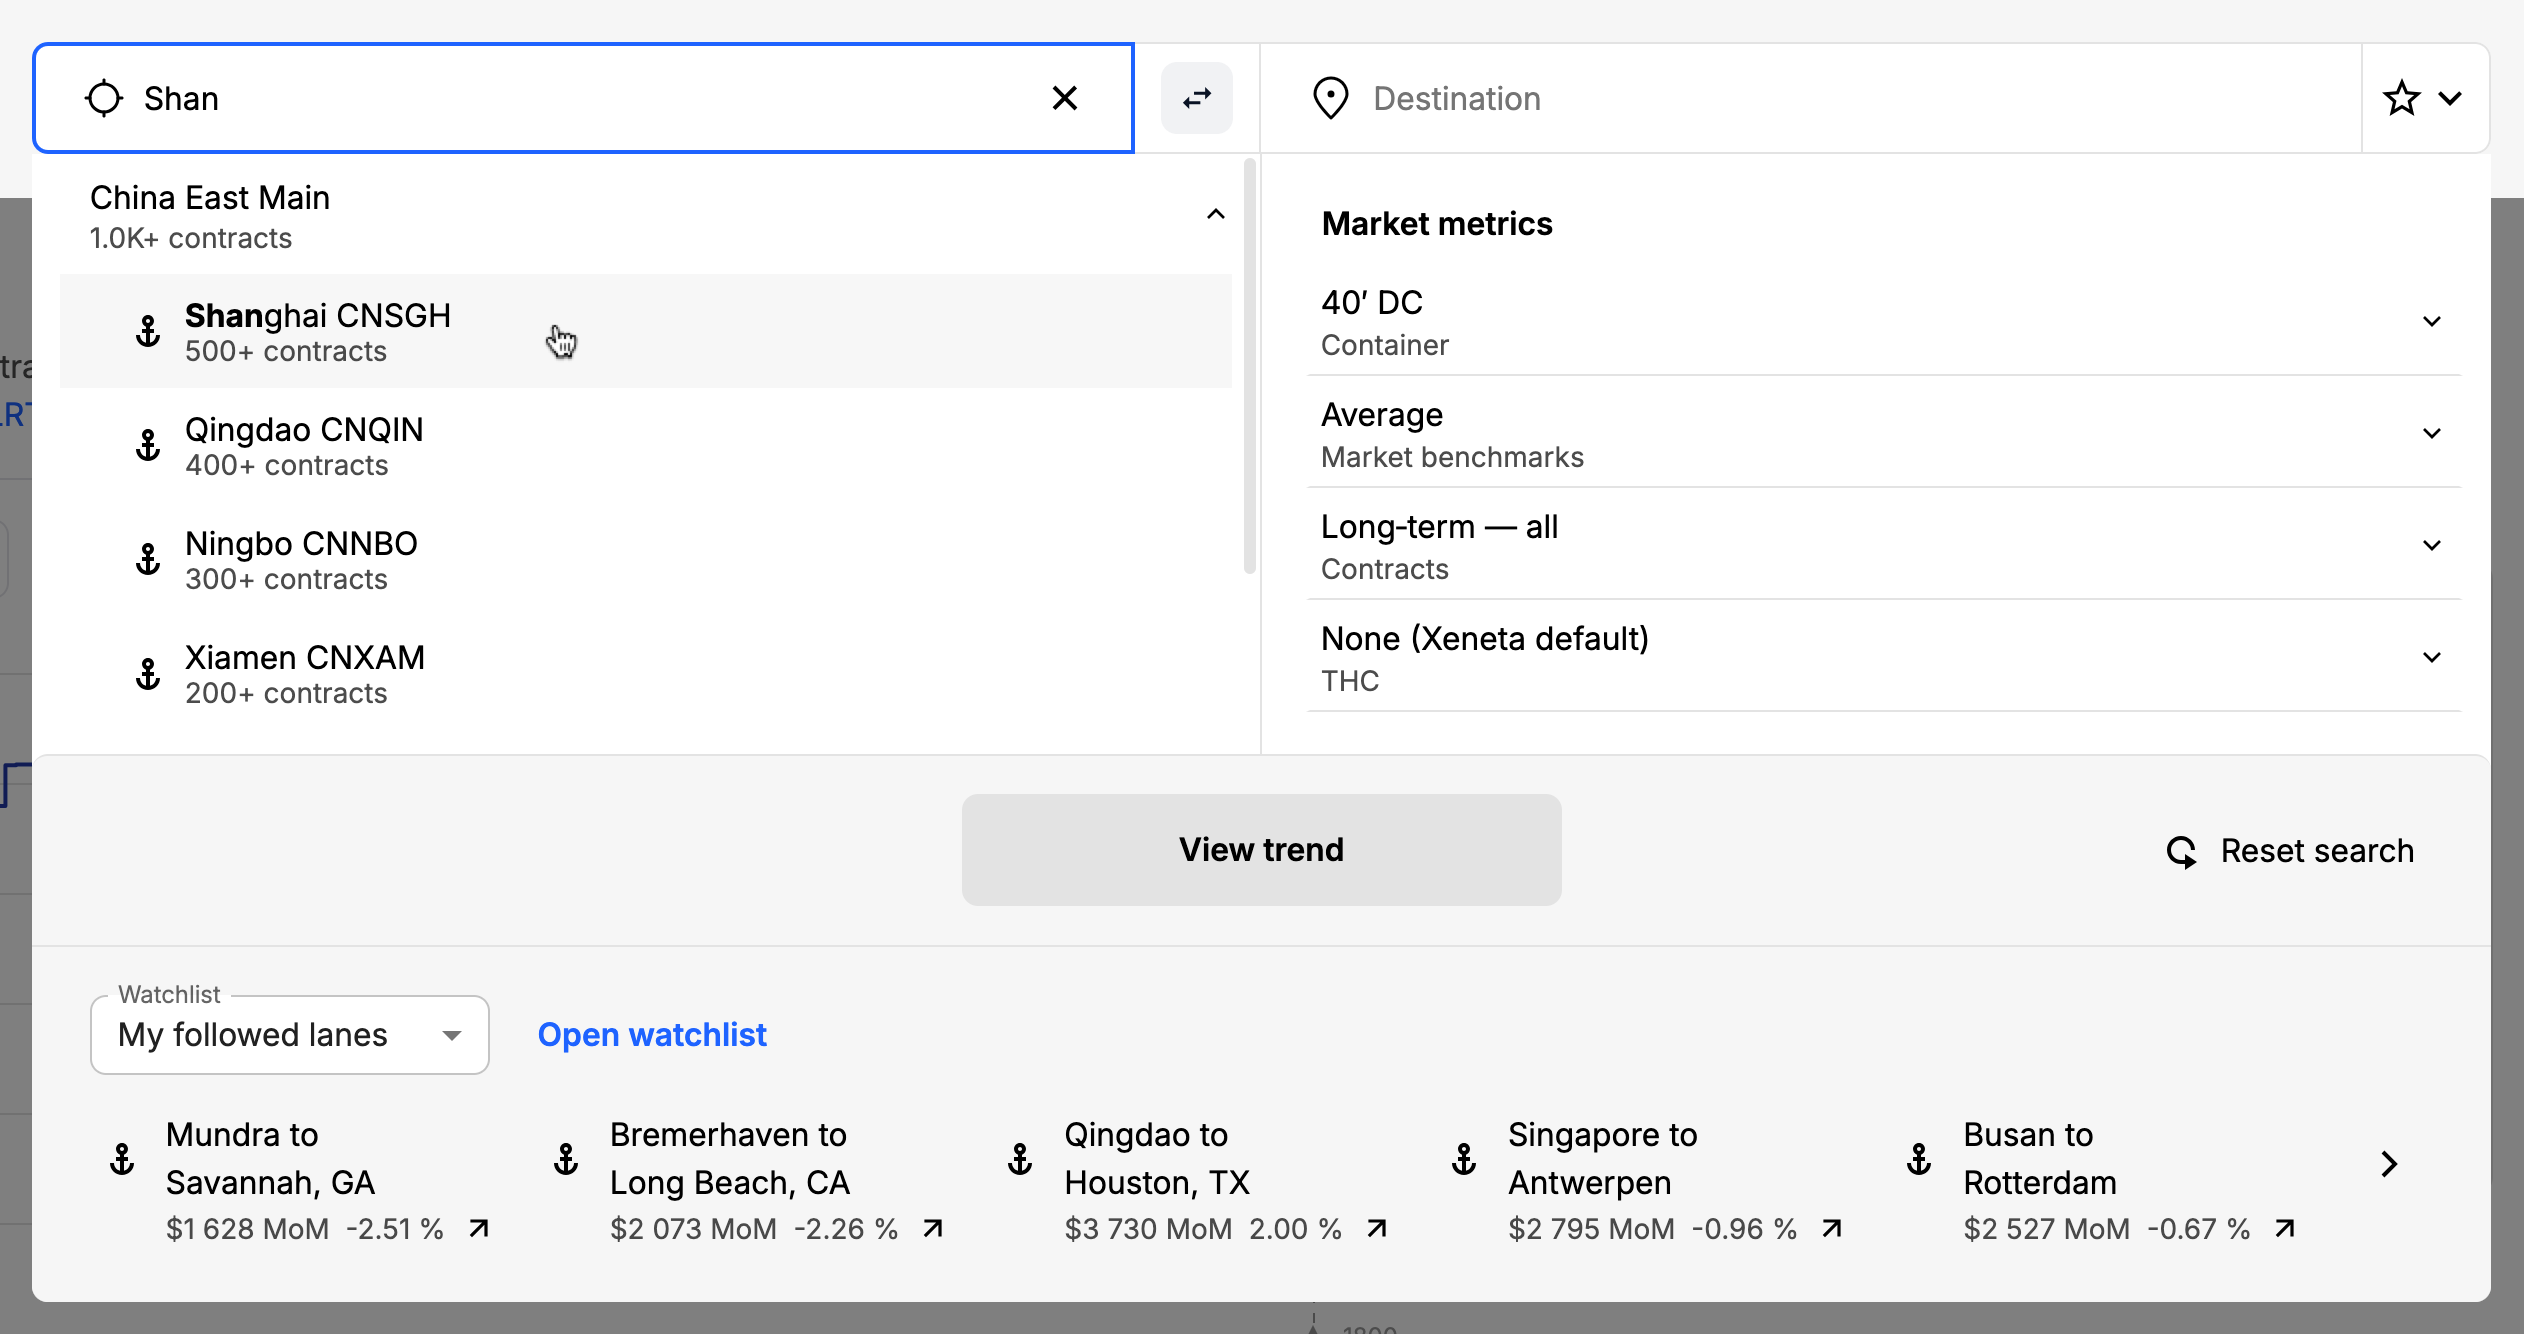
Adjust other search parameters such as container type, market segment, contract length and included THCs, or skip this step by clicking View trend to show the chart with the selected origin and destination using the default parameters.
The default parameters are: 40’ standard dry container, market average rates, short-term contracts, and no included THCs.
The bottom section of the search window shows the trade lanes from your most recently selected watchlist, along with their current rate and the change compared to the previous month. To learn more, see Watchlists.
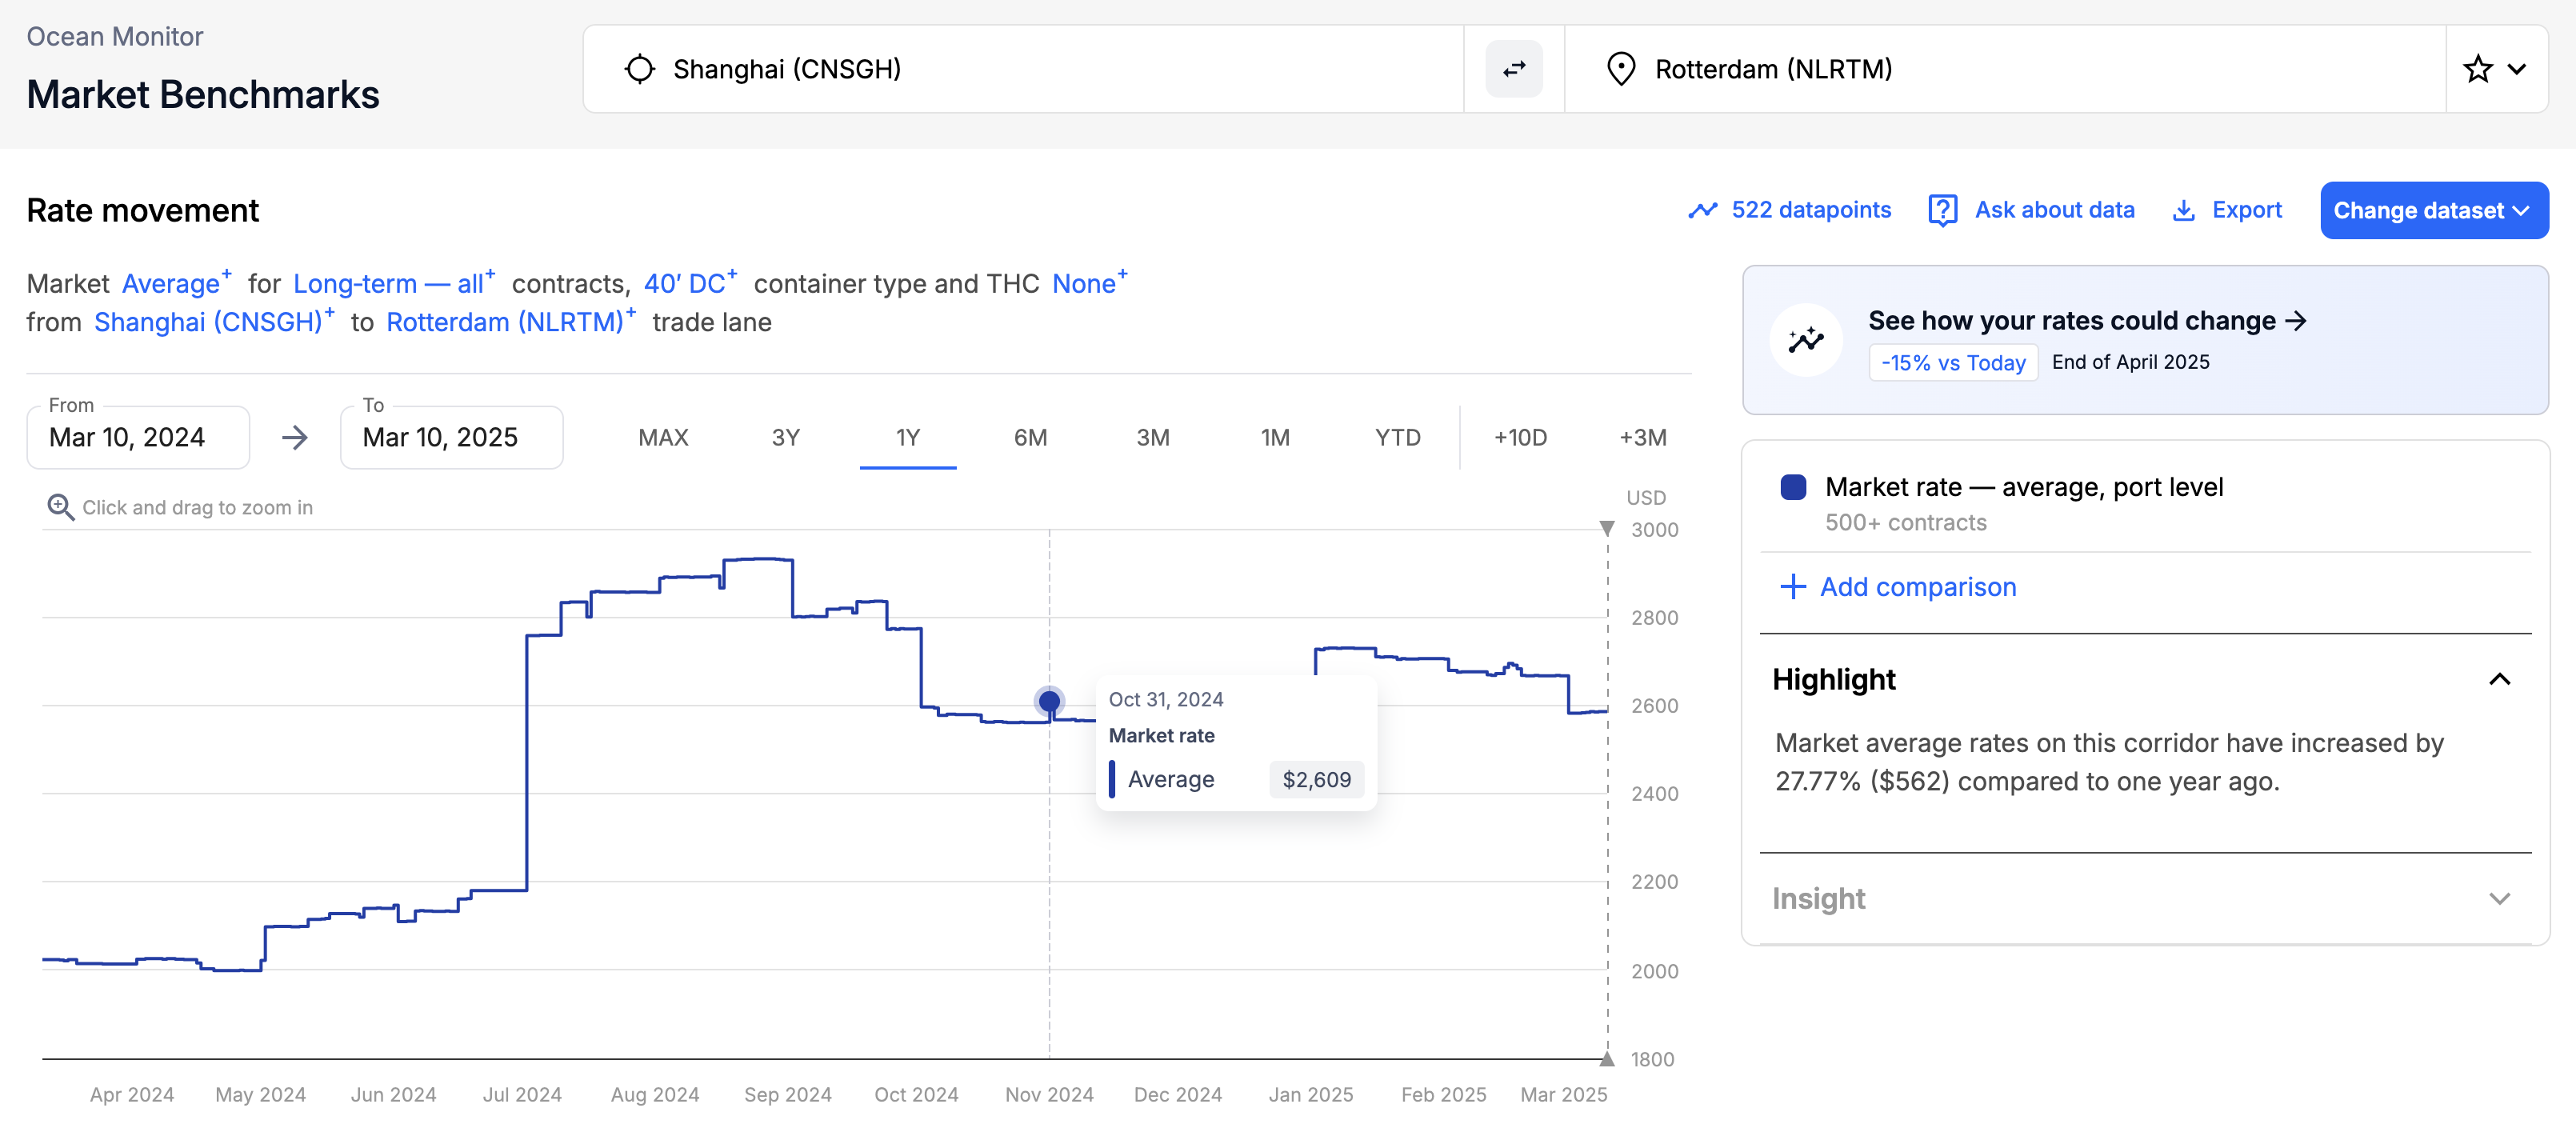
View rate movement
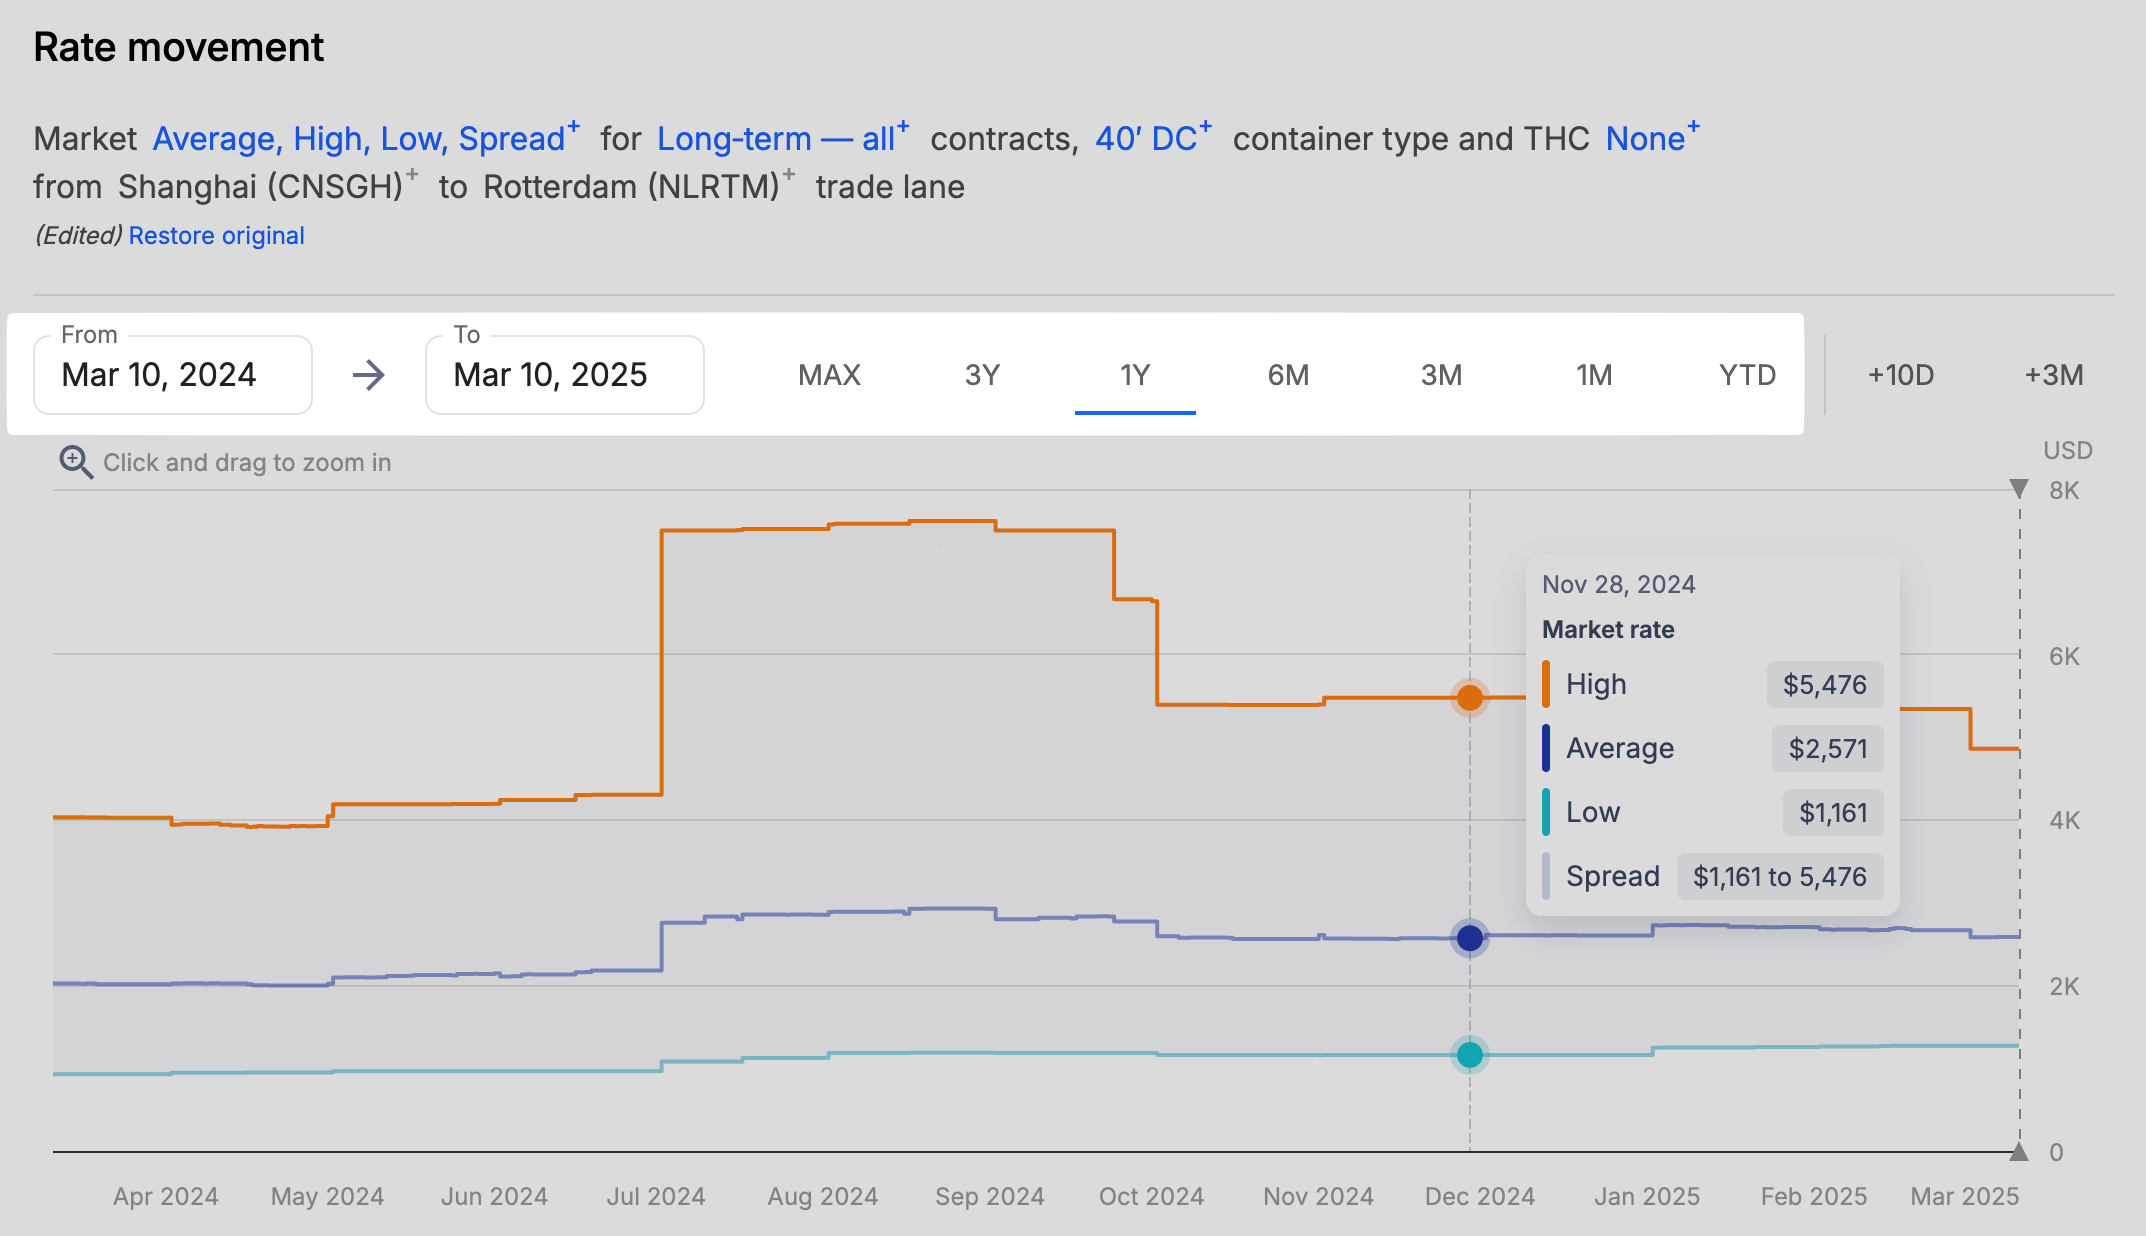
Once you click View trend, the Rate movement chart will be updated with the market rate data for your requested origin and destination:
The default view shows market data for a very large period. If you need to look at a more narrow section, you can select the date range manually, or use the quick select options:
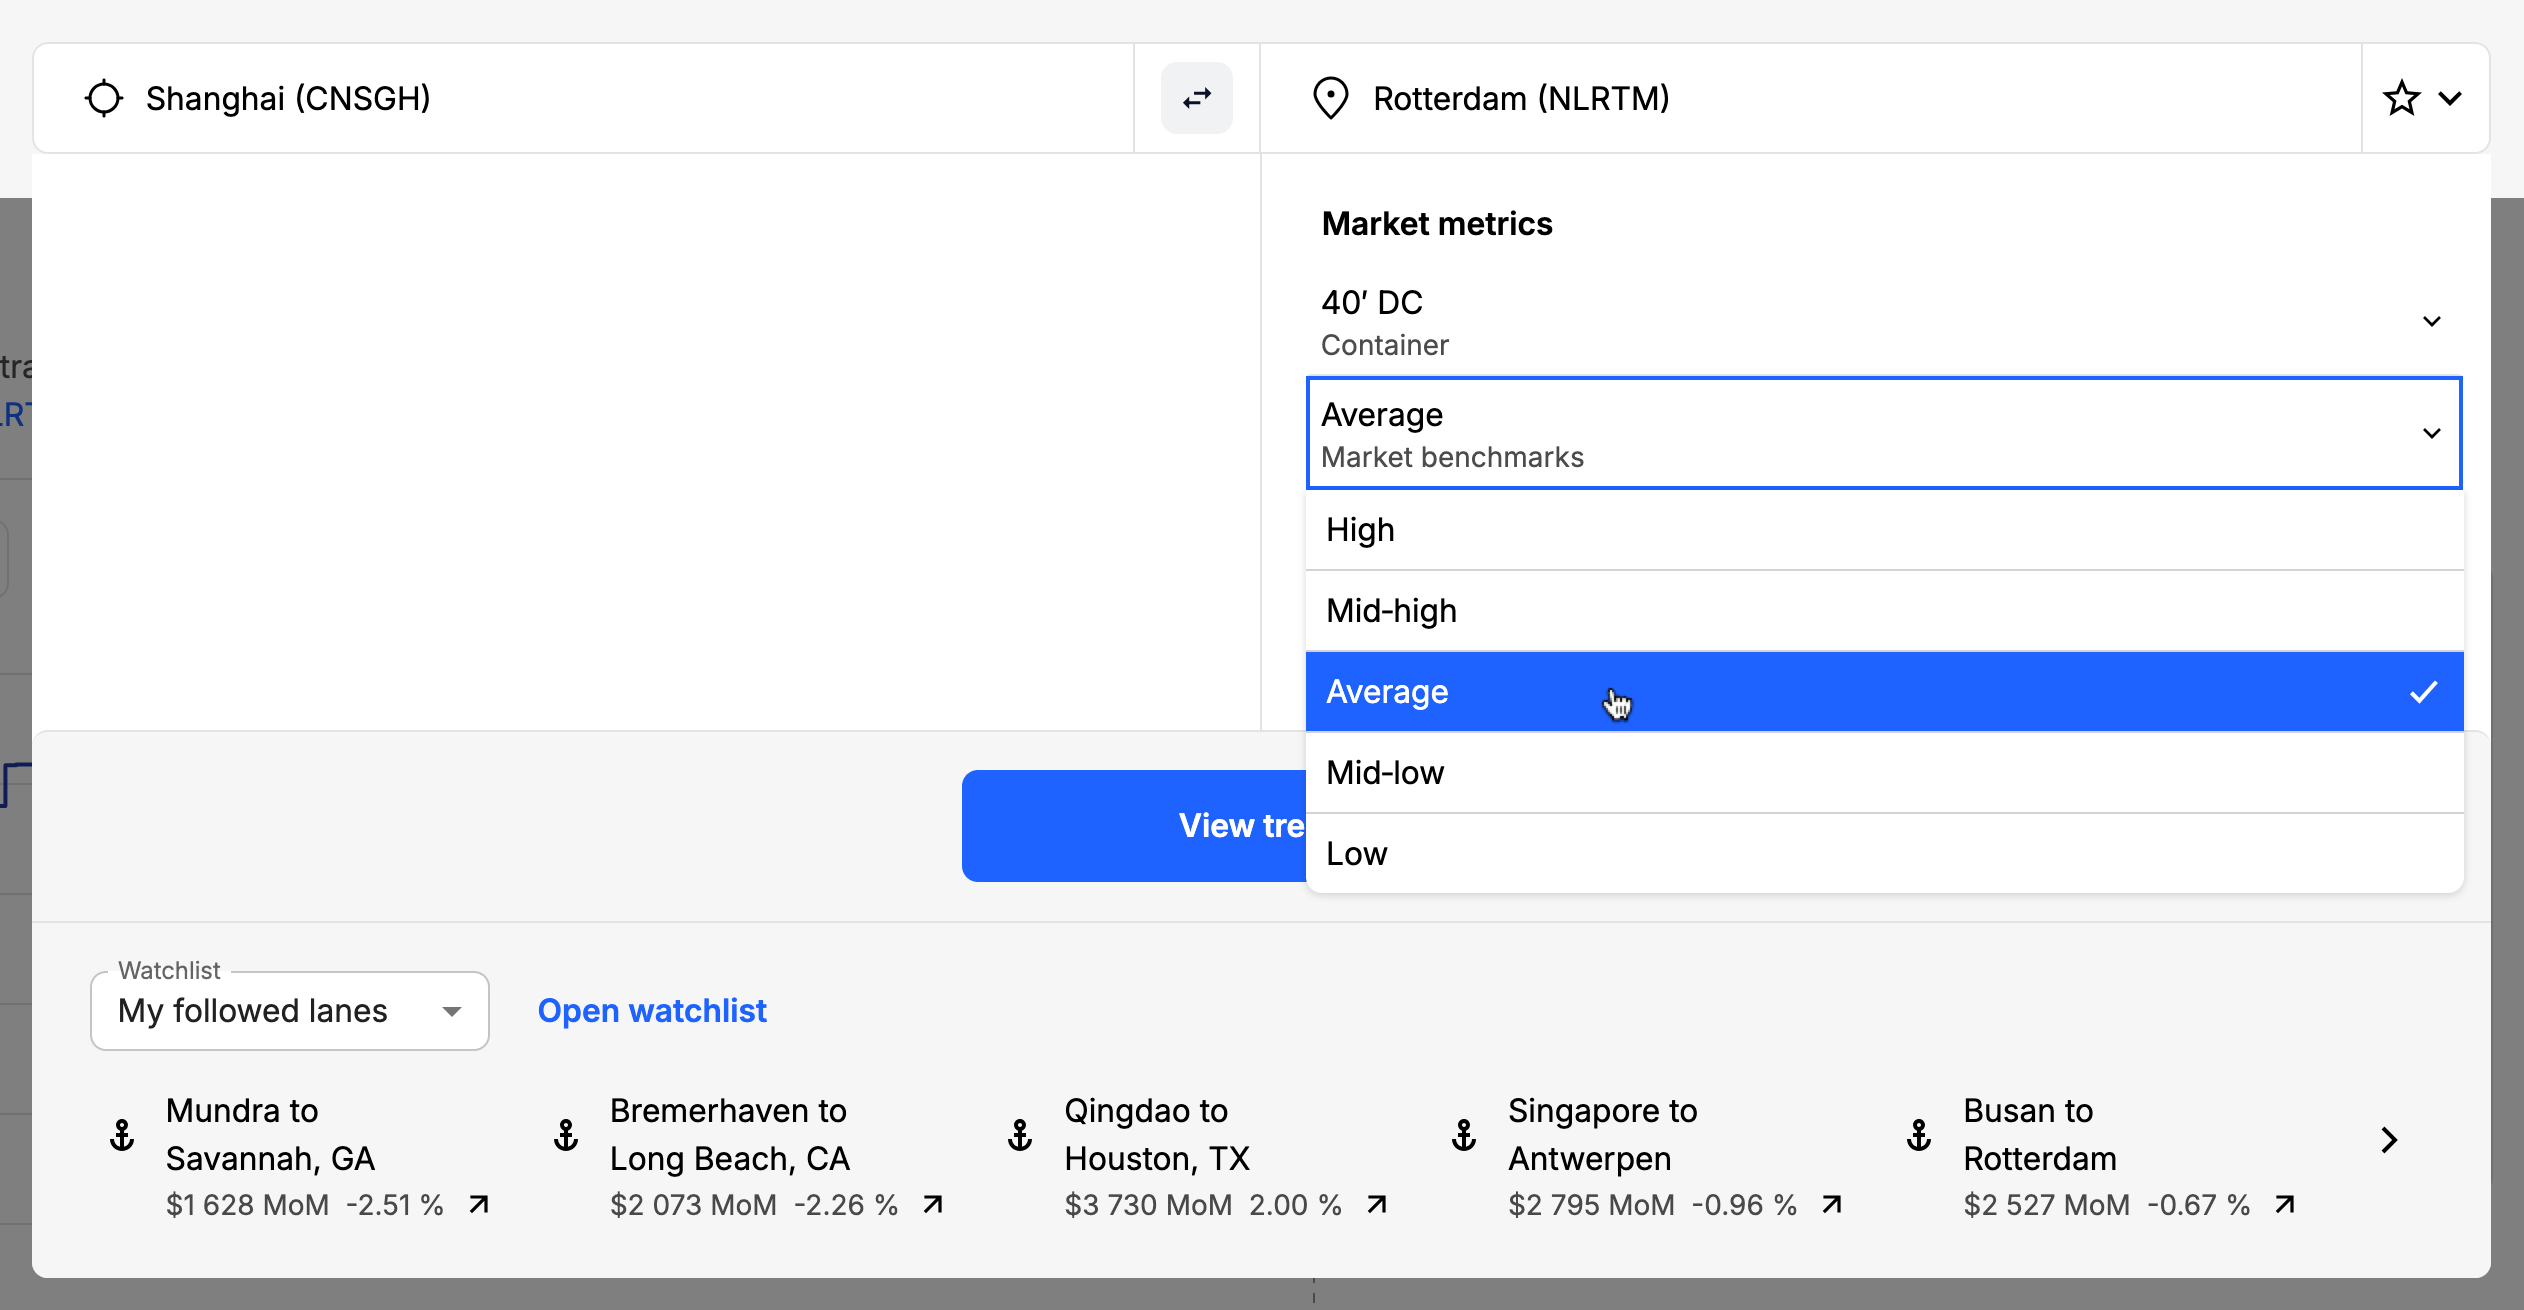
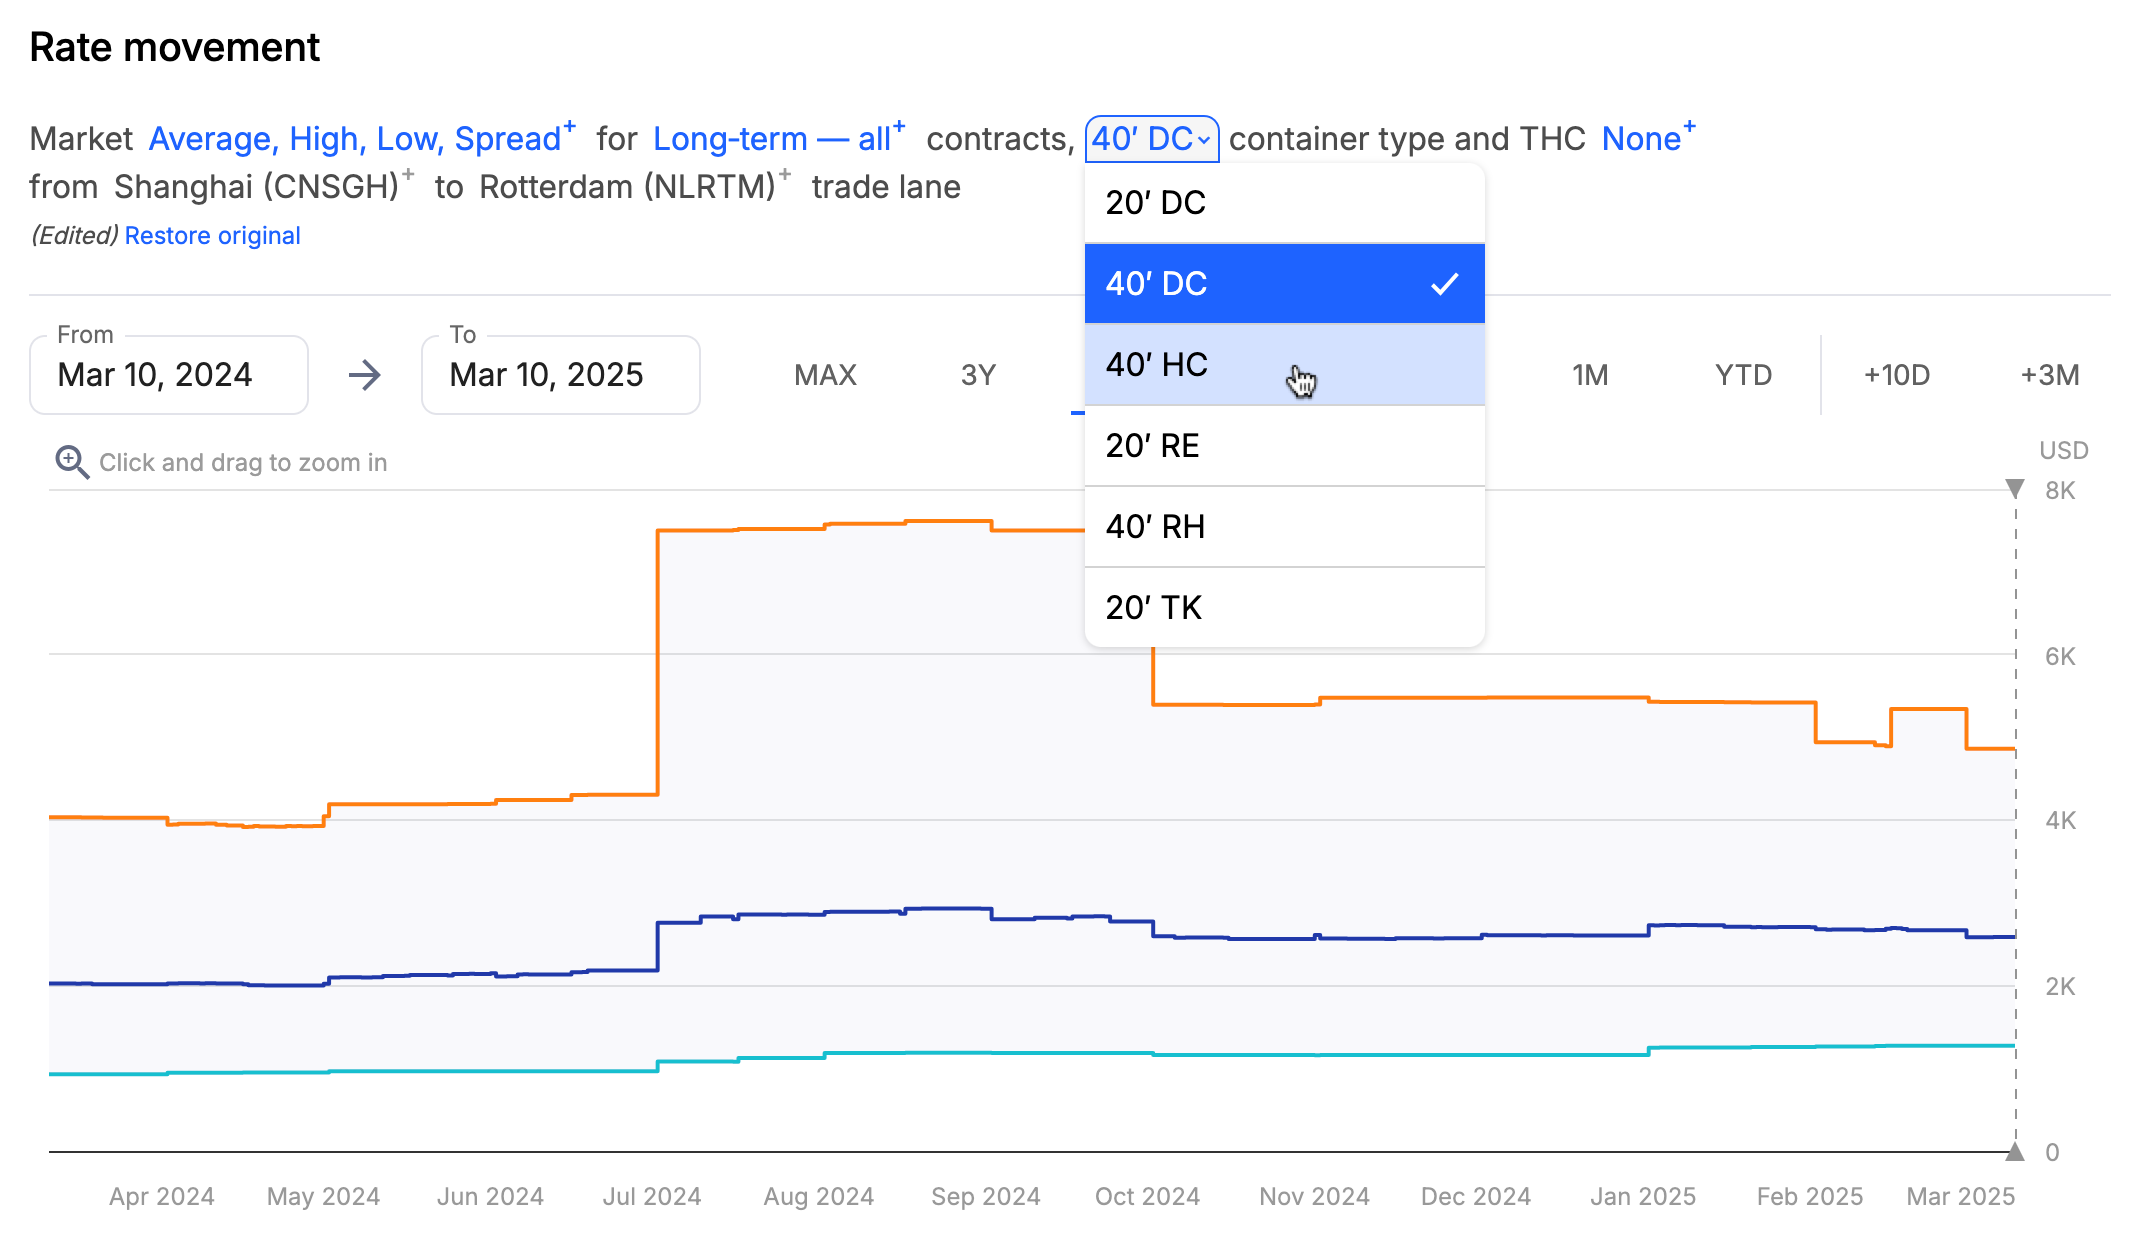
If you need to quickly adjust the parameters of the chart without necessarily changing the selected origin or destination, you can use the interactive description at the top of the chart:
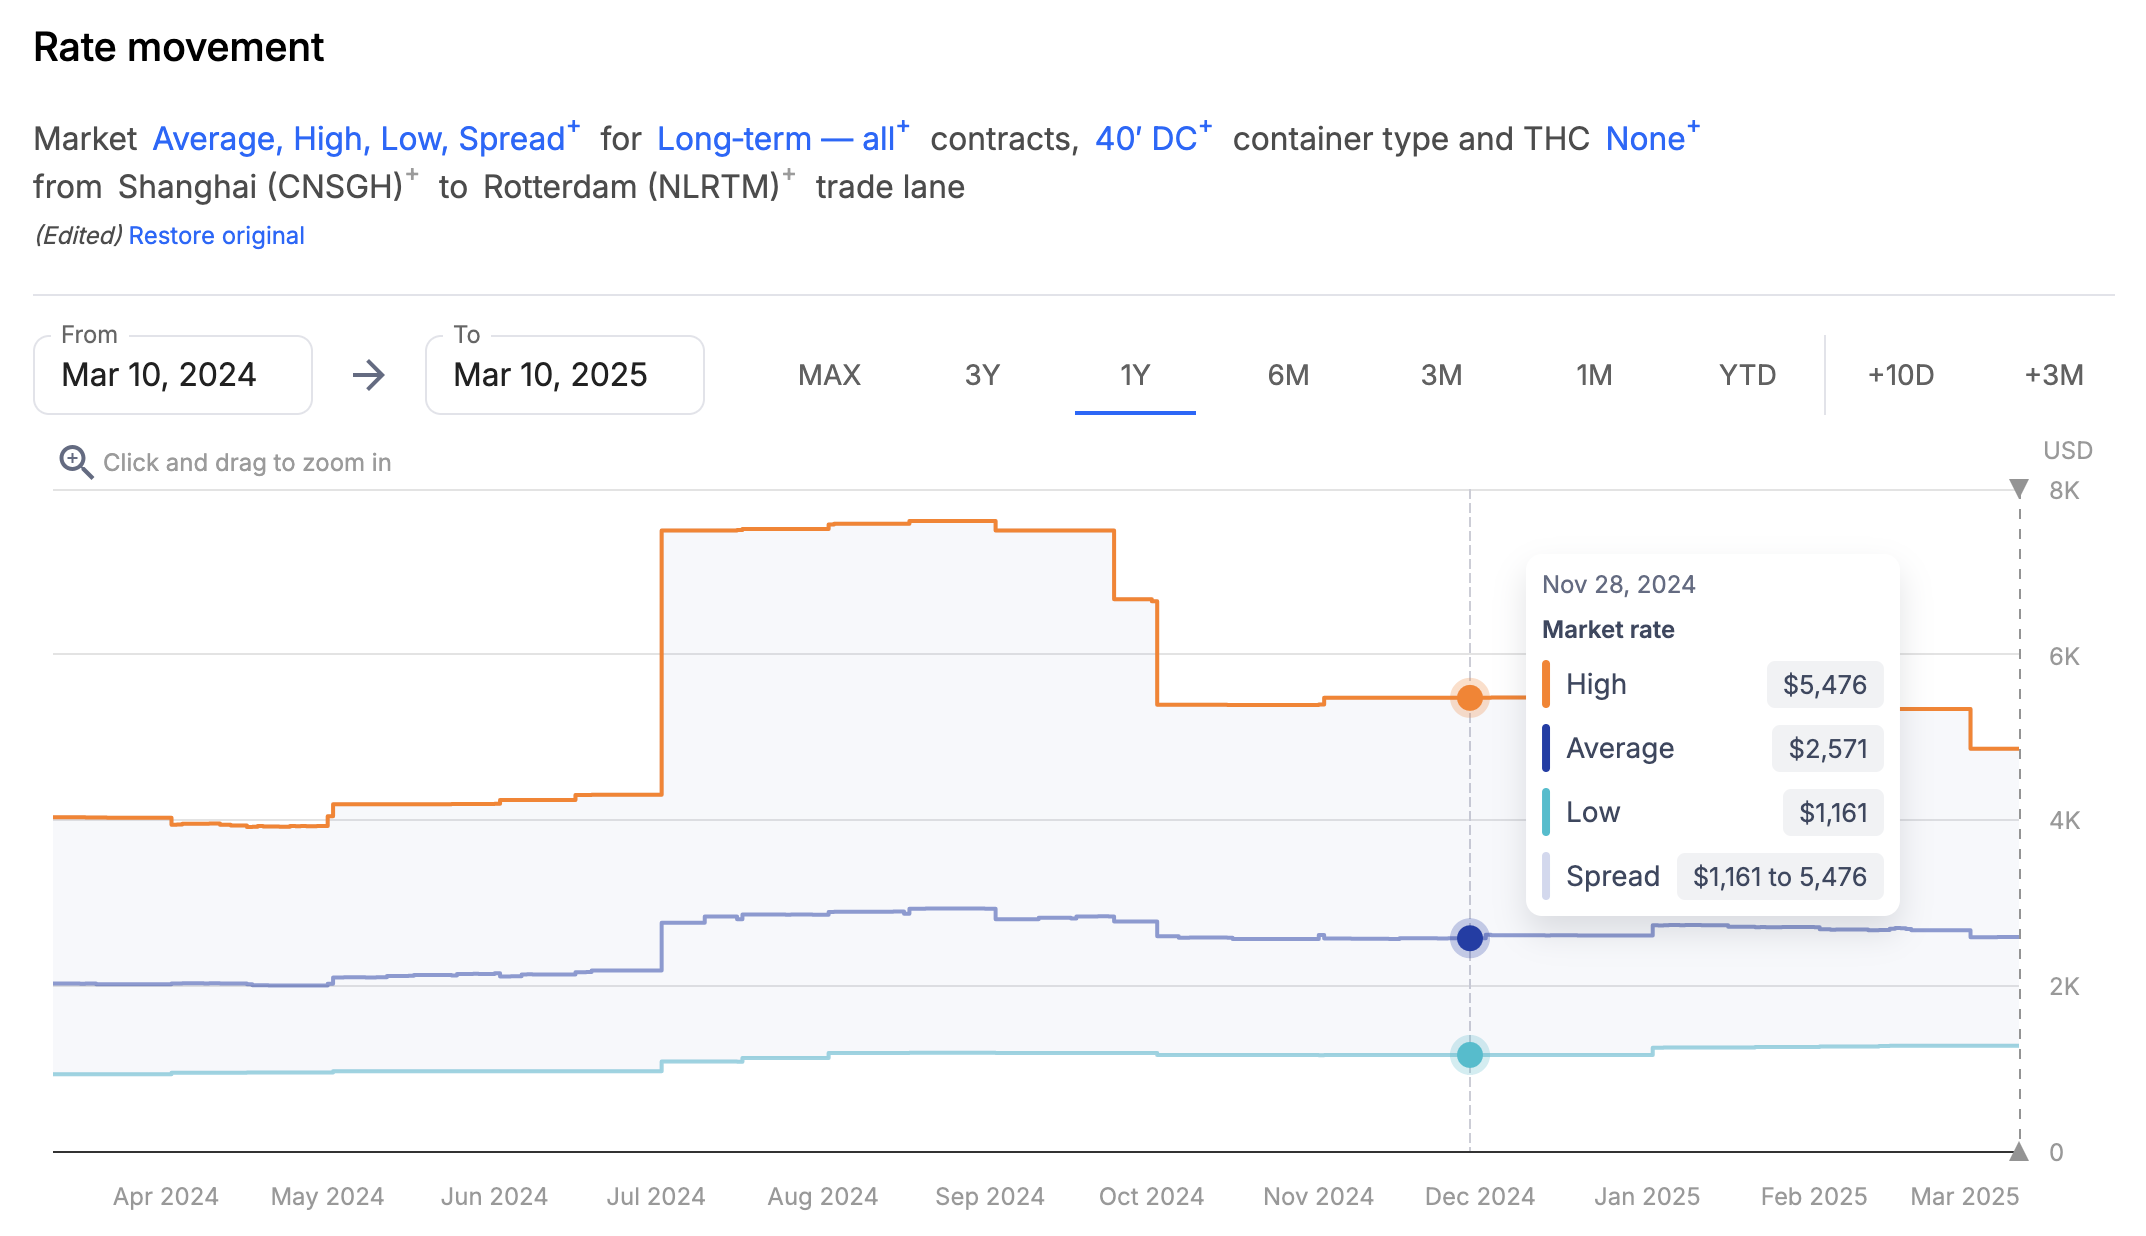
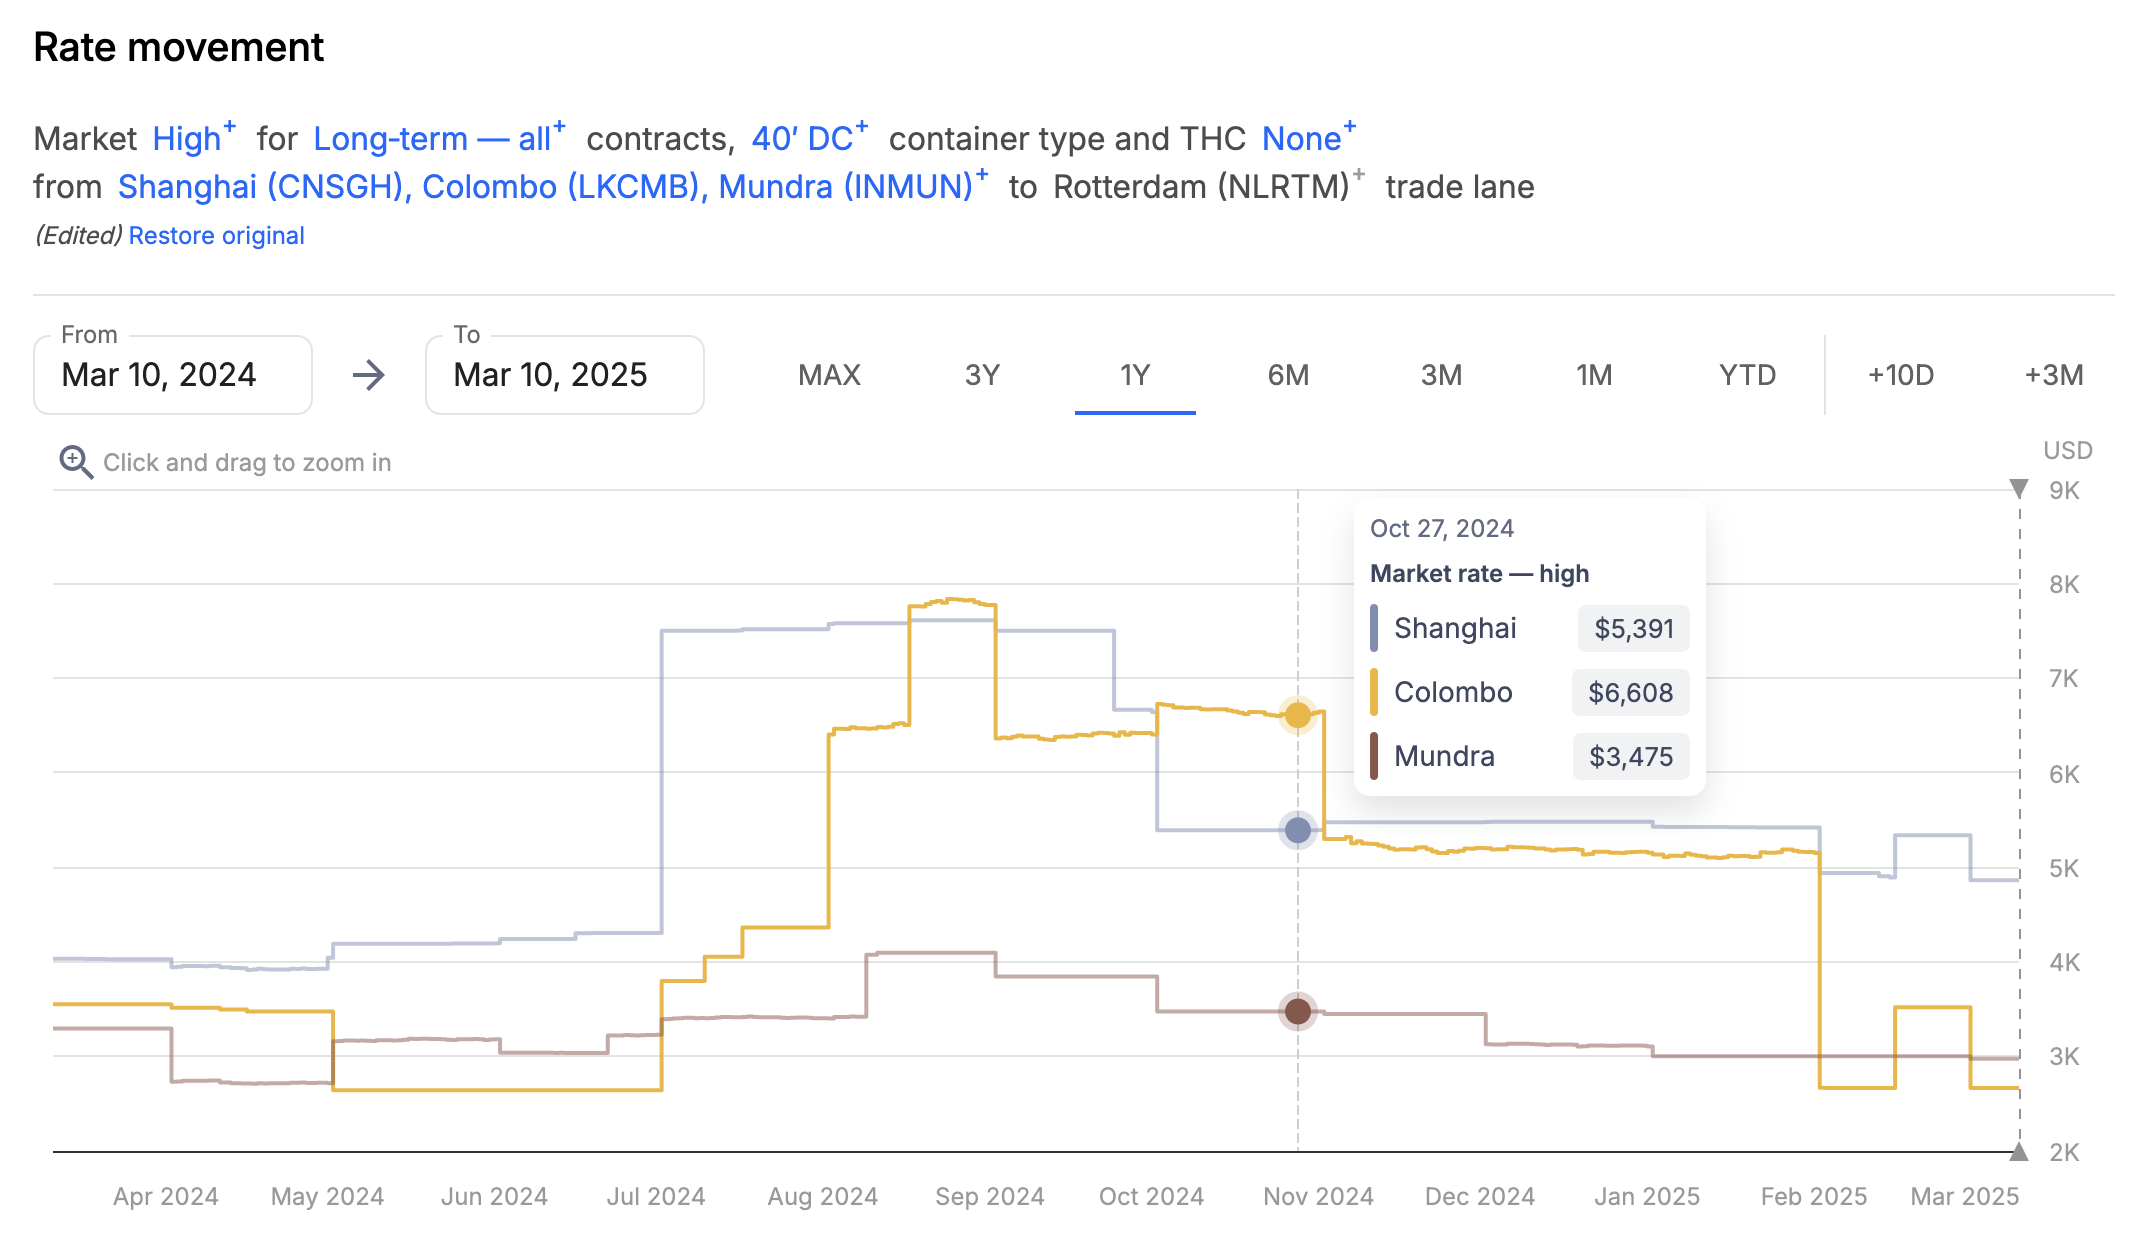
Some parameters allow you to select multiple options at a time. This way, you can compare data across multiple market segments, container types, or origins or destinations. For example:
- View market low, average, and high rates on a specific corridor or trade lane
- Compare short- and long-term rates on a specific corridor or trade lane
- Compare market rates for different container types on a specific corridor or trade lane
- Compare market rates to one destination from multiple origins, and the other way around
Note that you can only make multiple selections for a single parameter. For example, if you select two container types, you will only be able to select one contract type and market segment.
View future rates
To view rates associated with contracts that are starting in the future, select the +3M or +10D option in the date range section of the chart:
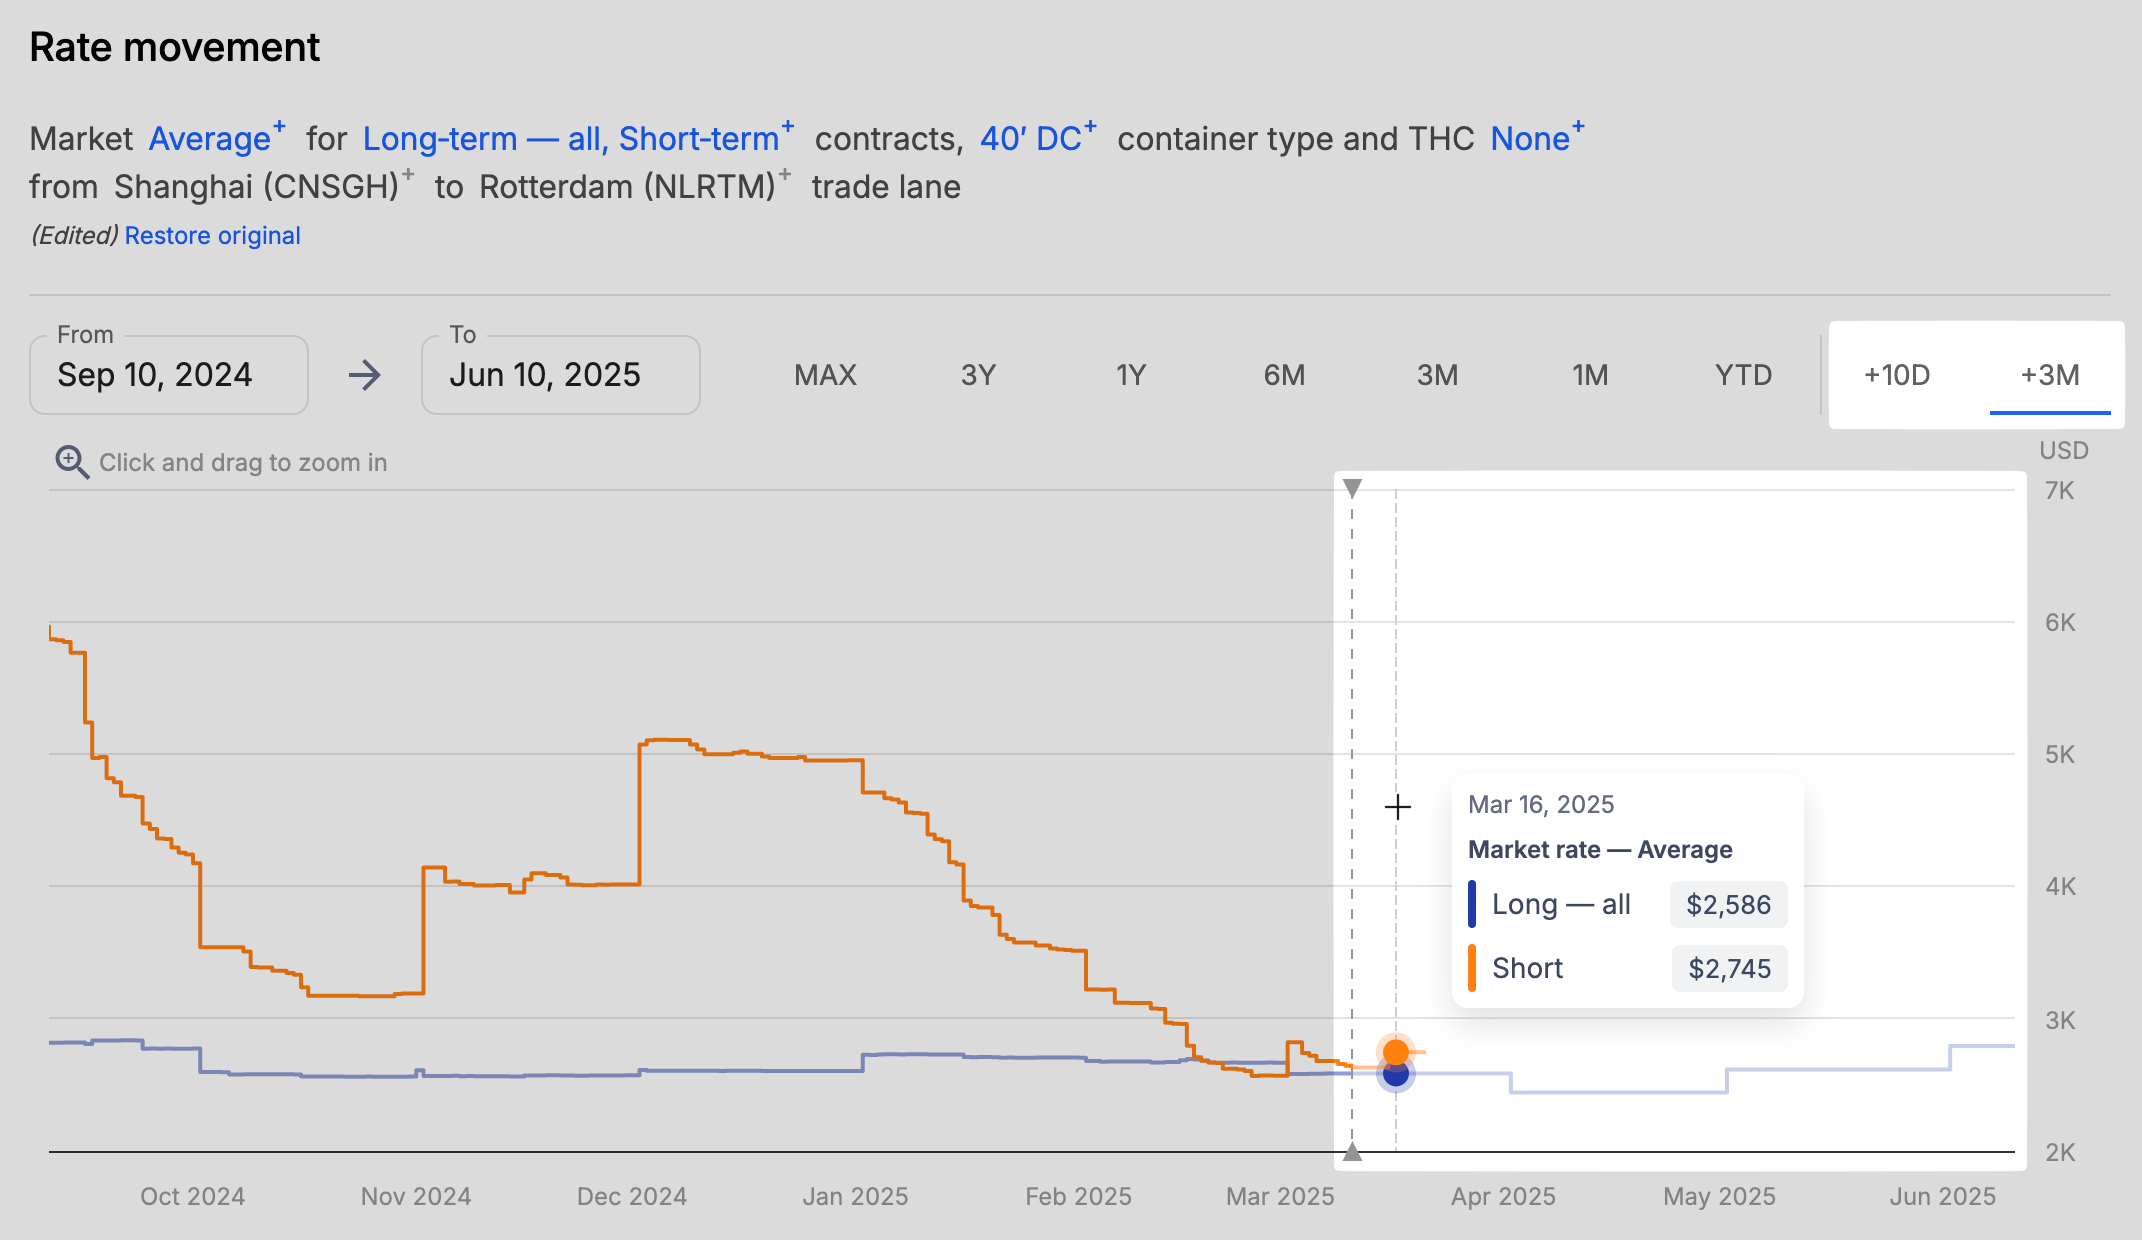
The future rates view is limited to 3 months and 10 days for long- and short-term contracts respectively, and allows you to see where the market is likely to be trending in the near future. To learn more, see Future rates.
For a predicted view of future market rates on a longer timeline, see Market rate outlook.
Add your rates
To add the rates from your suppliers to the chart and compare your performance to the market, click Add comparison to the right of the graph and go to Your rates to select a specific supplier or contract:
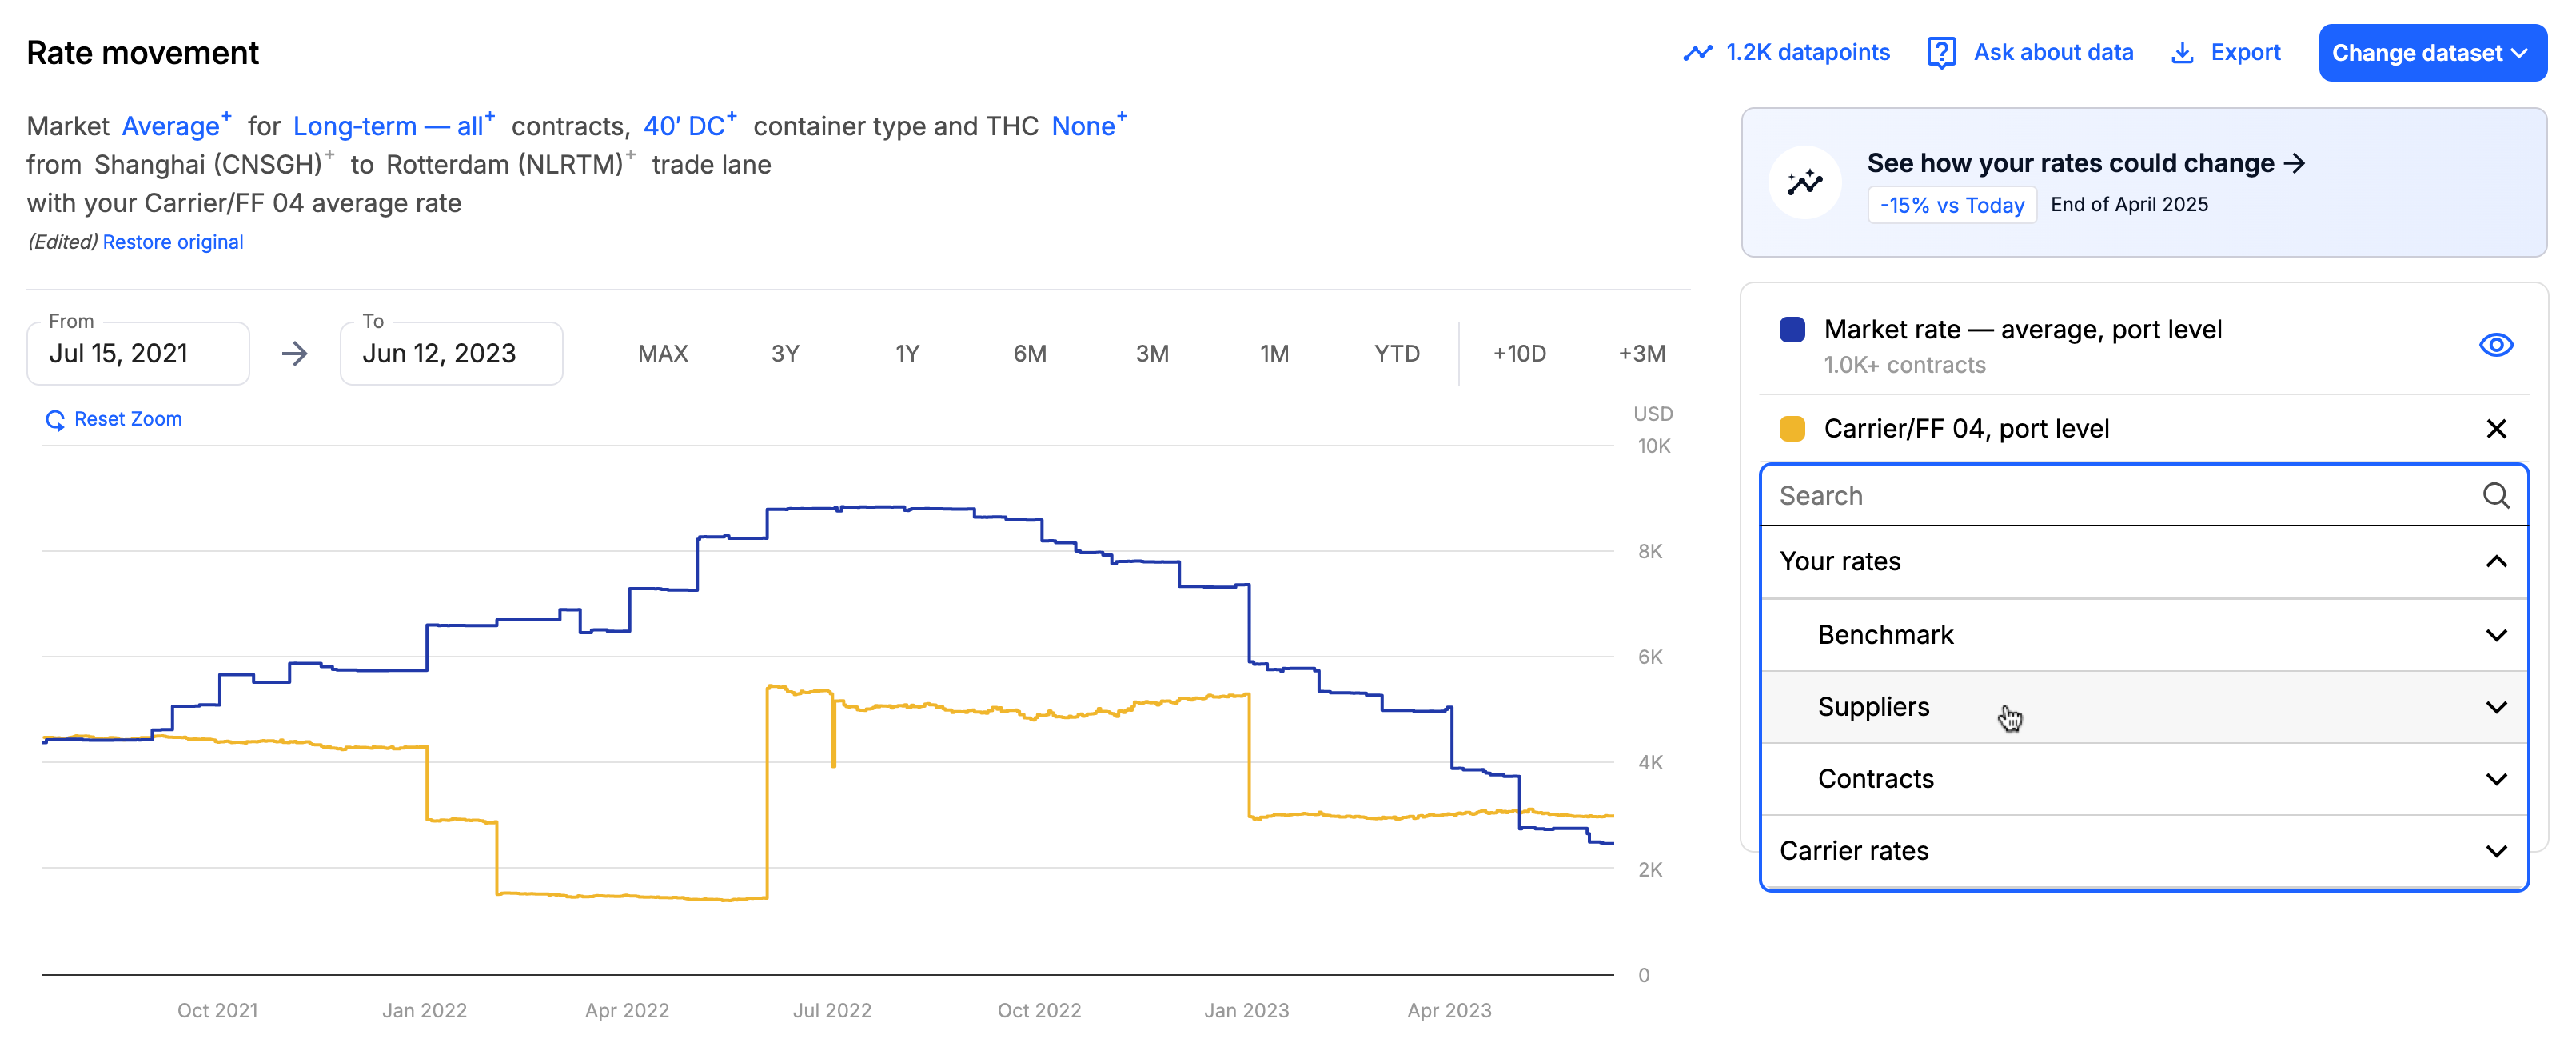
Using Your rates, you can see how the rates from your suppliers and partners available in Xeneta compare to the larger ocean freight market.
The accuracy and availability of your rates in Xeneta depends on the rate sheets we receive from you. Be sure to provide us with your data regularly and without delay to be able to benchmark yourself against the market.
Add carrier rates
To add rates from specific ocean carriers to the chart and see how they compare to the larger market, click Add comparison and go to Carrier rates to select a specific carrier:
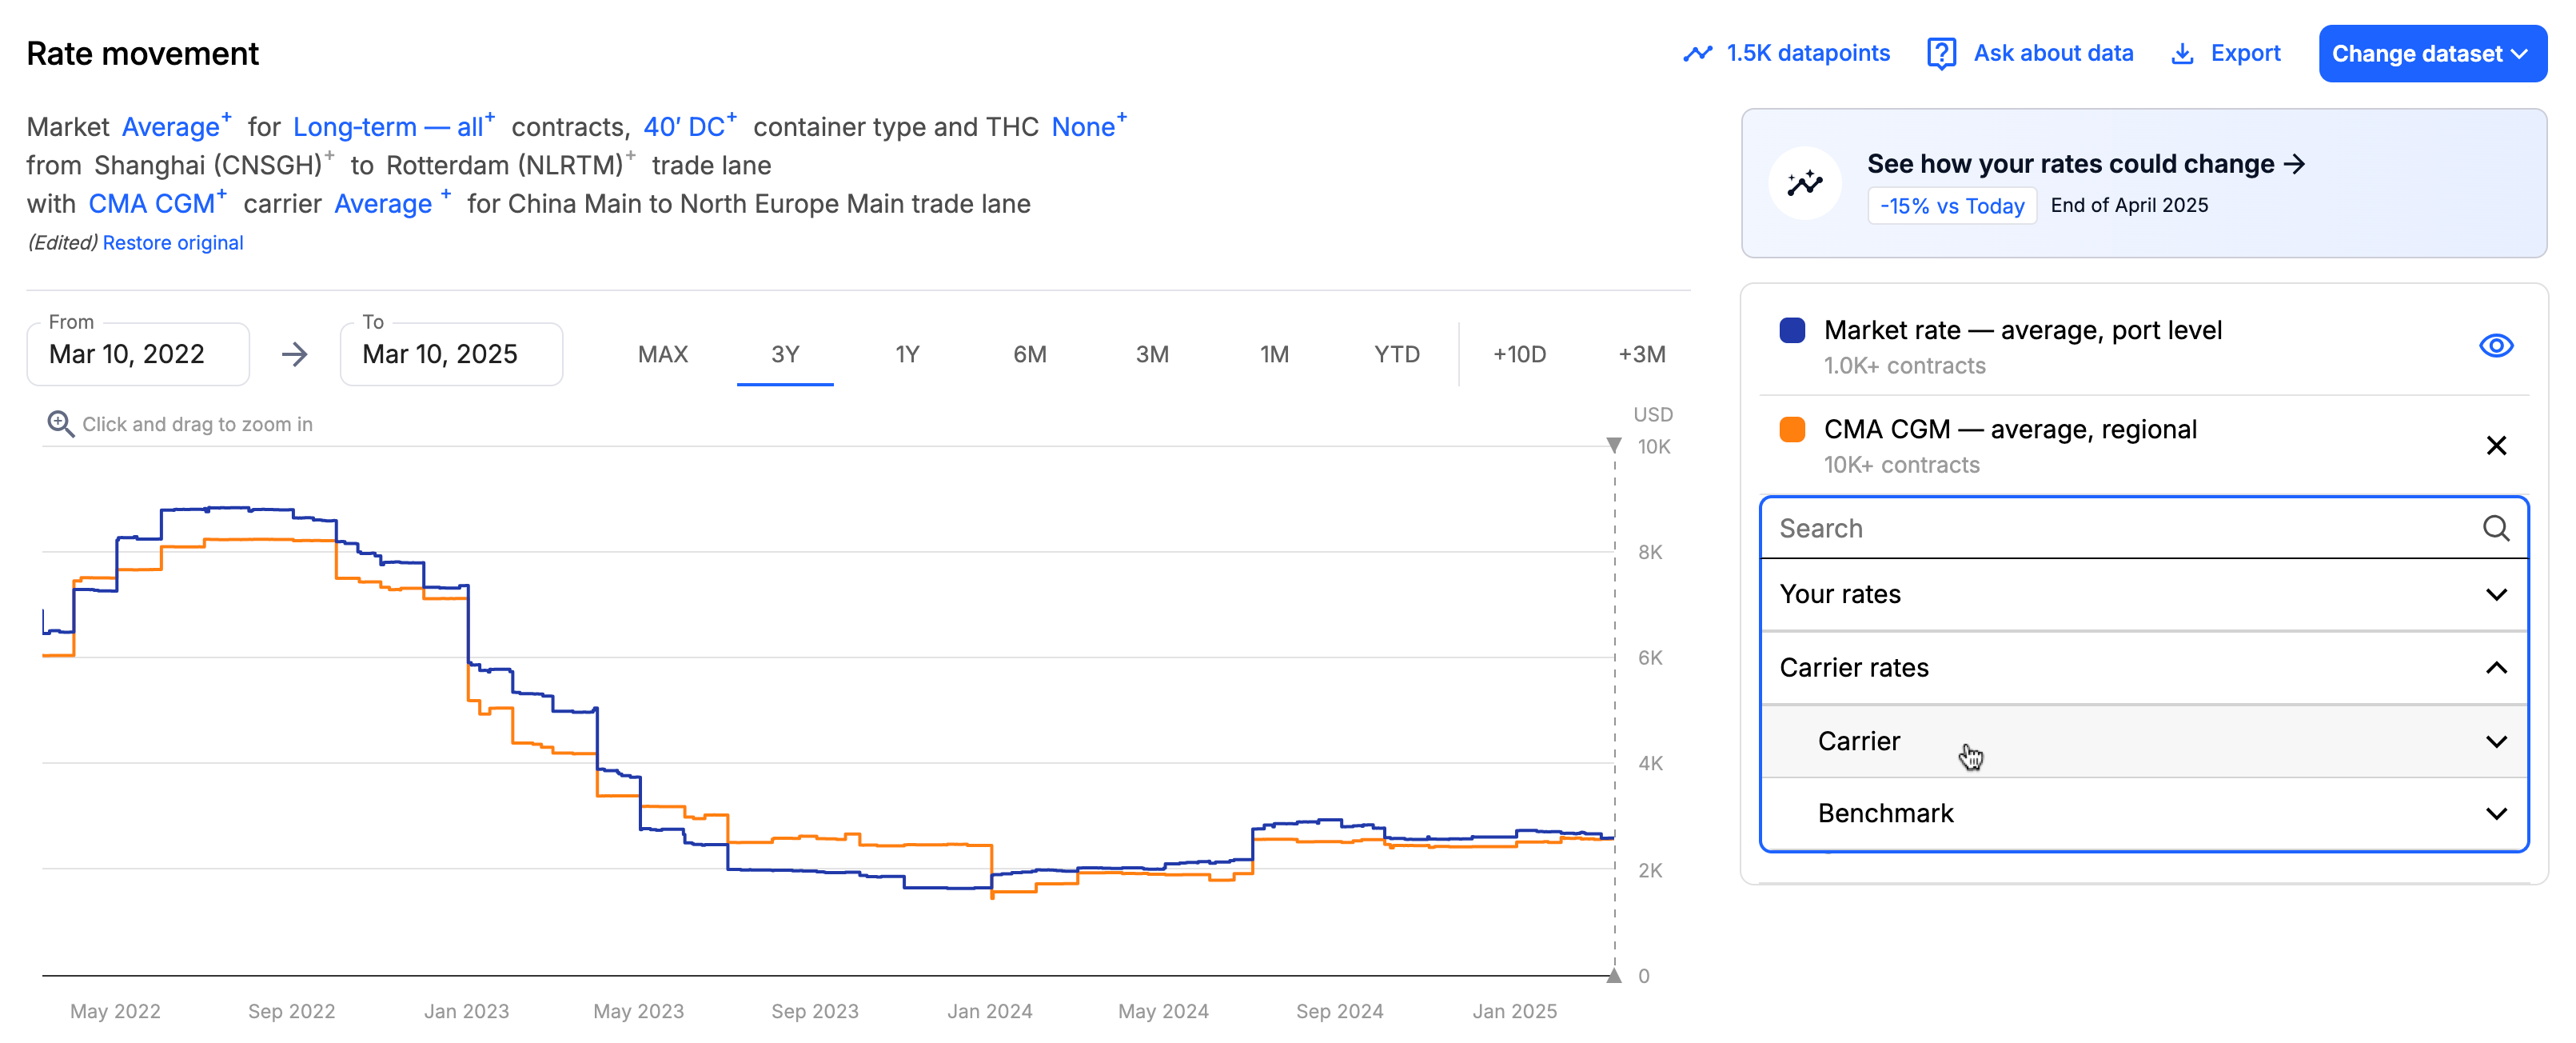
To learn more, see Carrier rates.
Add routing
To add the routing option and compare rates to or from inland locations in North America depending on the coast, select a supported location as your origin or destination (for example, Chicago Rail Ramps) and then choose from the available routing options:
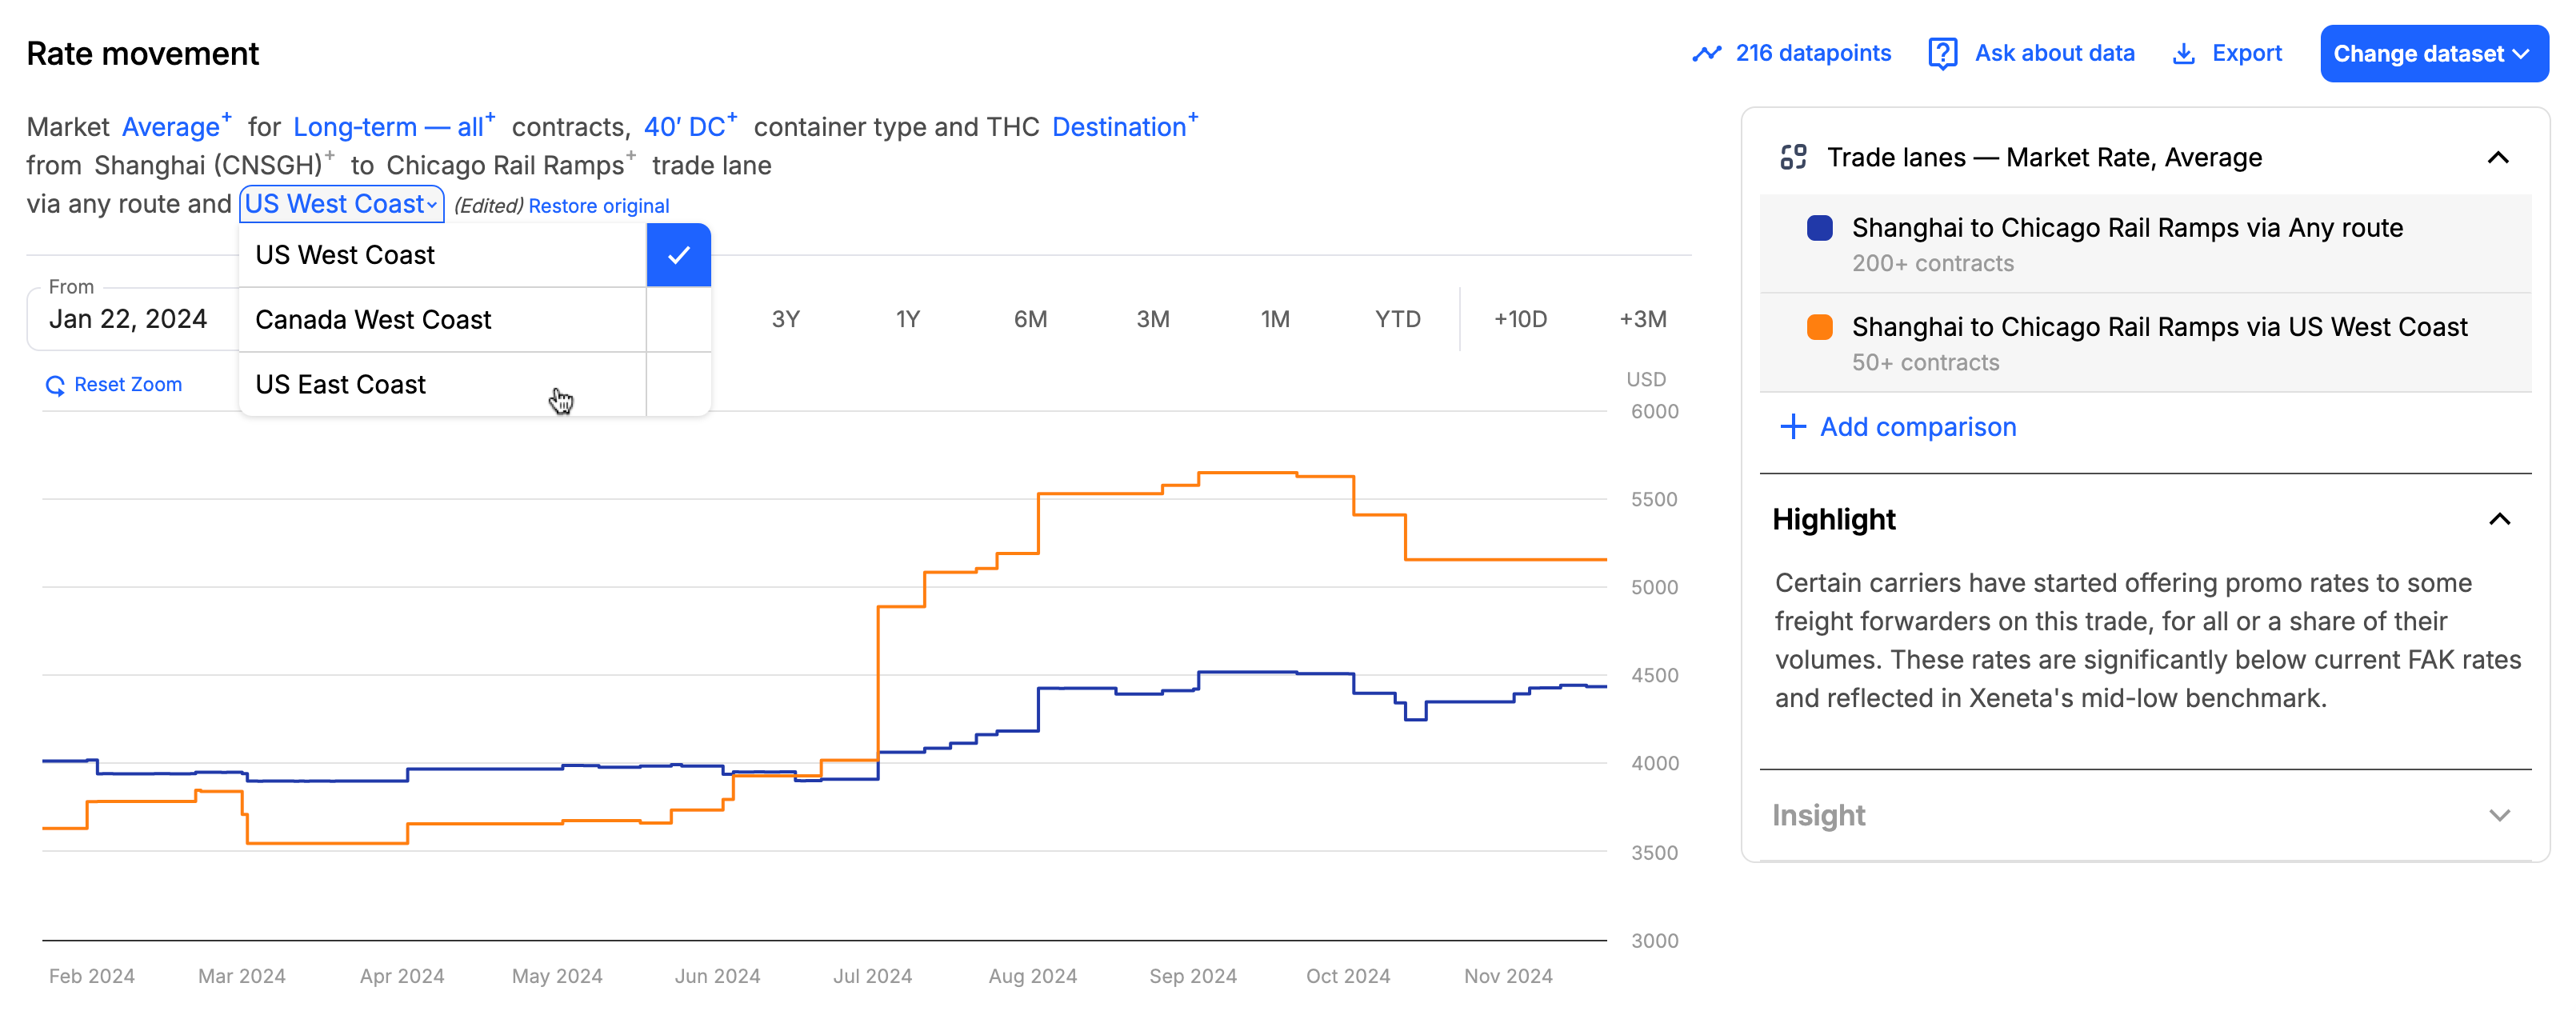
To learn more, see North America routing.
View schedule reliability
Select Reliability in the Change dataset menu to access the carrier schedule reliability data and display it as a trend alongside the market rates:
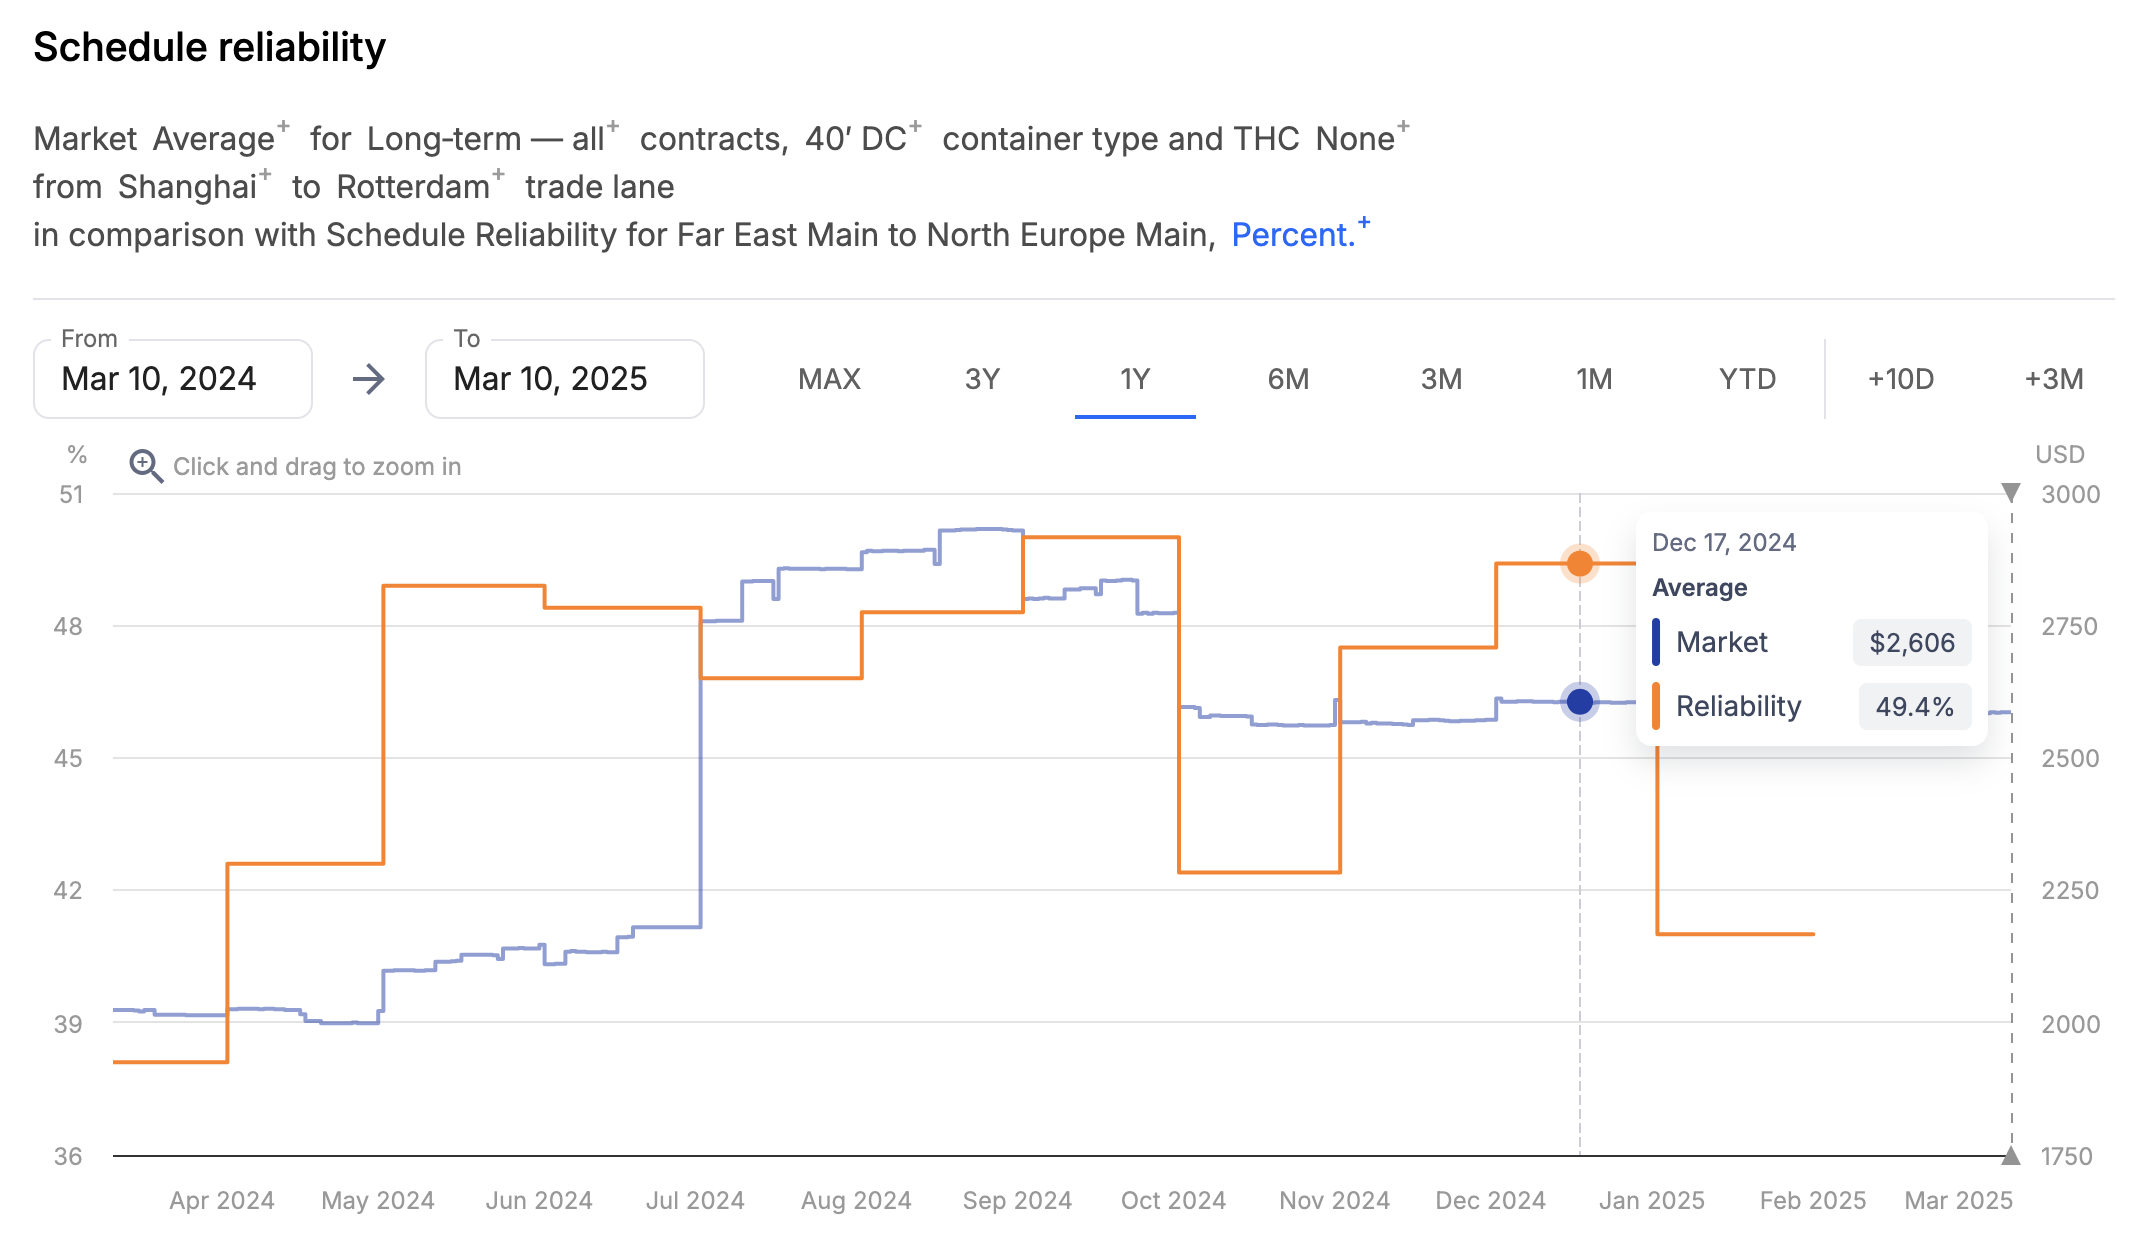
To learn more, see Schedule reliability.
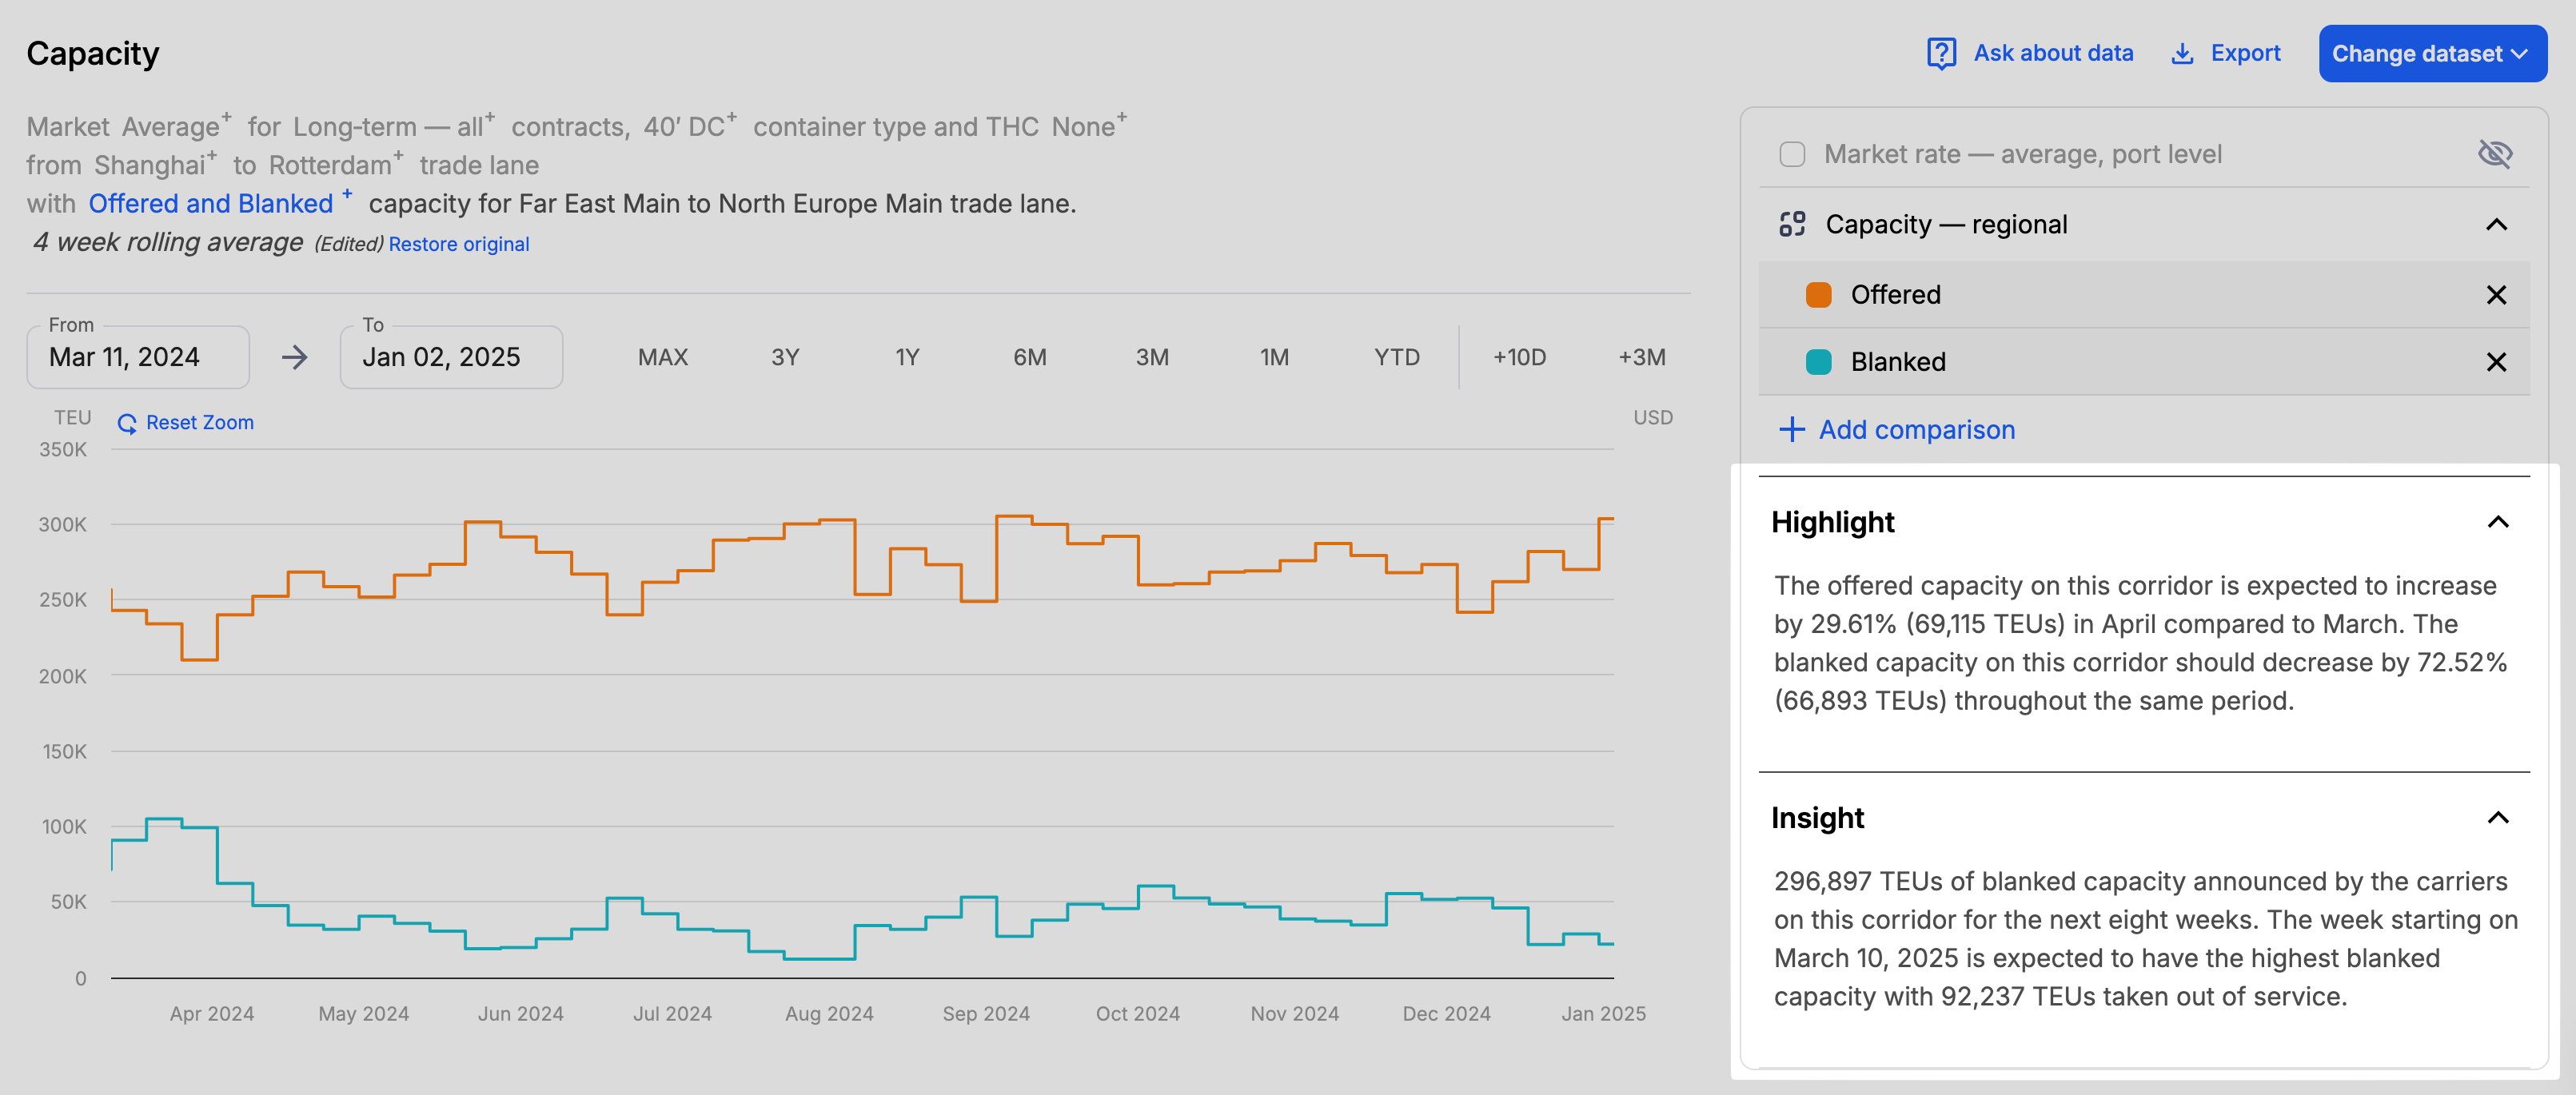
View capacity and blanked sailings
Select Capacity in the Change dataset menu to access the data on offered and blanked capacity and see how it correlates with the market rates:
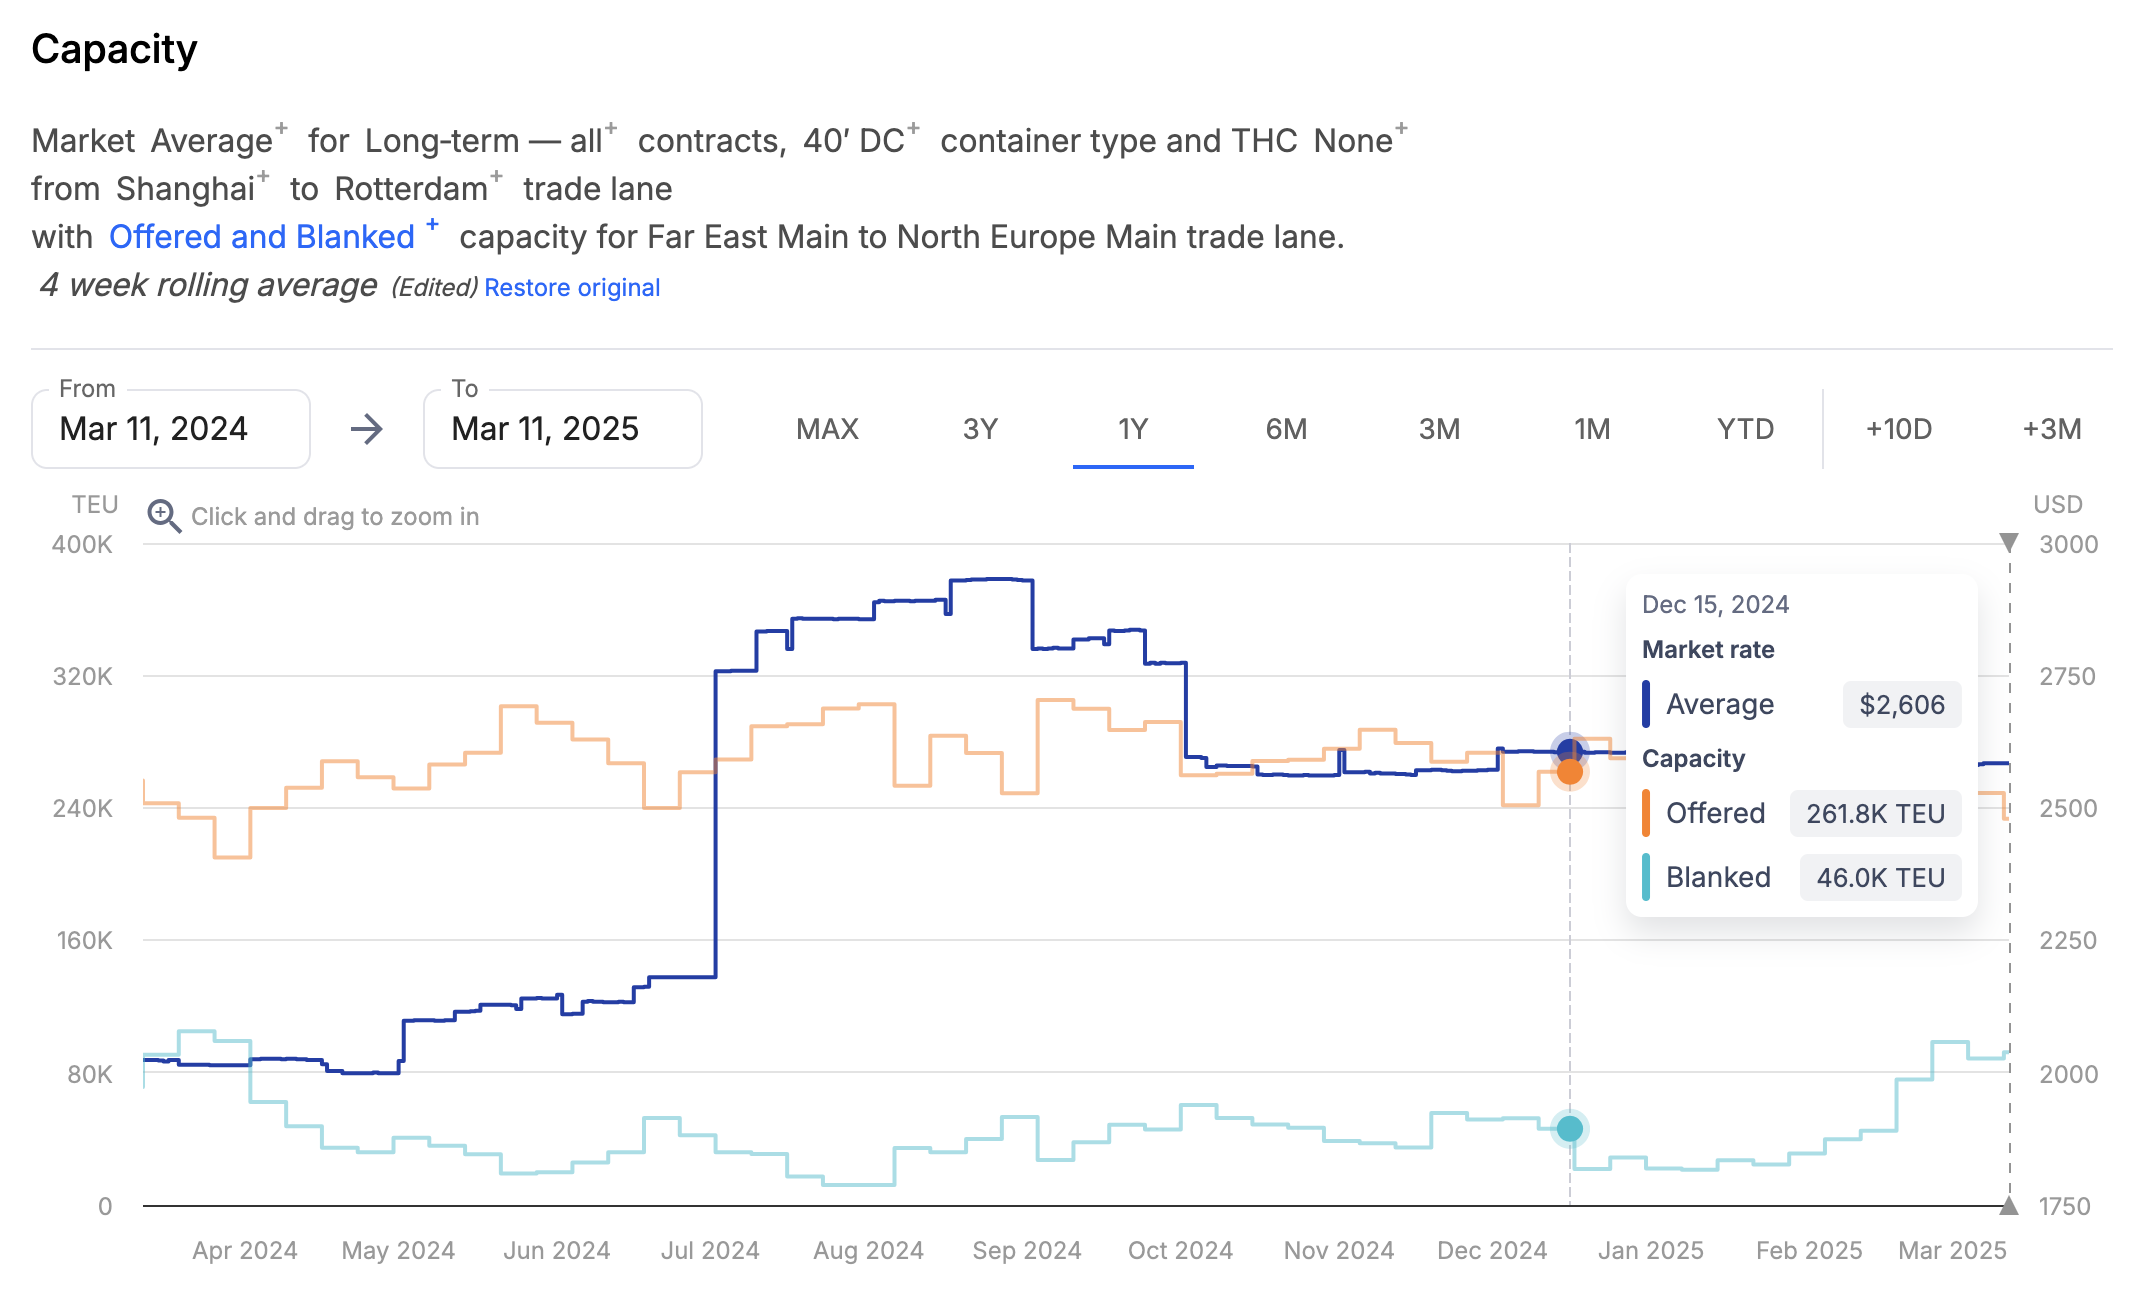
To learn more, see Capacity.
View transit times
Switch to Transit times in the Change dataset menu to access the data on announced and actual transit time across specific corridors or port pairs and see how it correlates with the market rates:
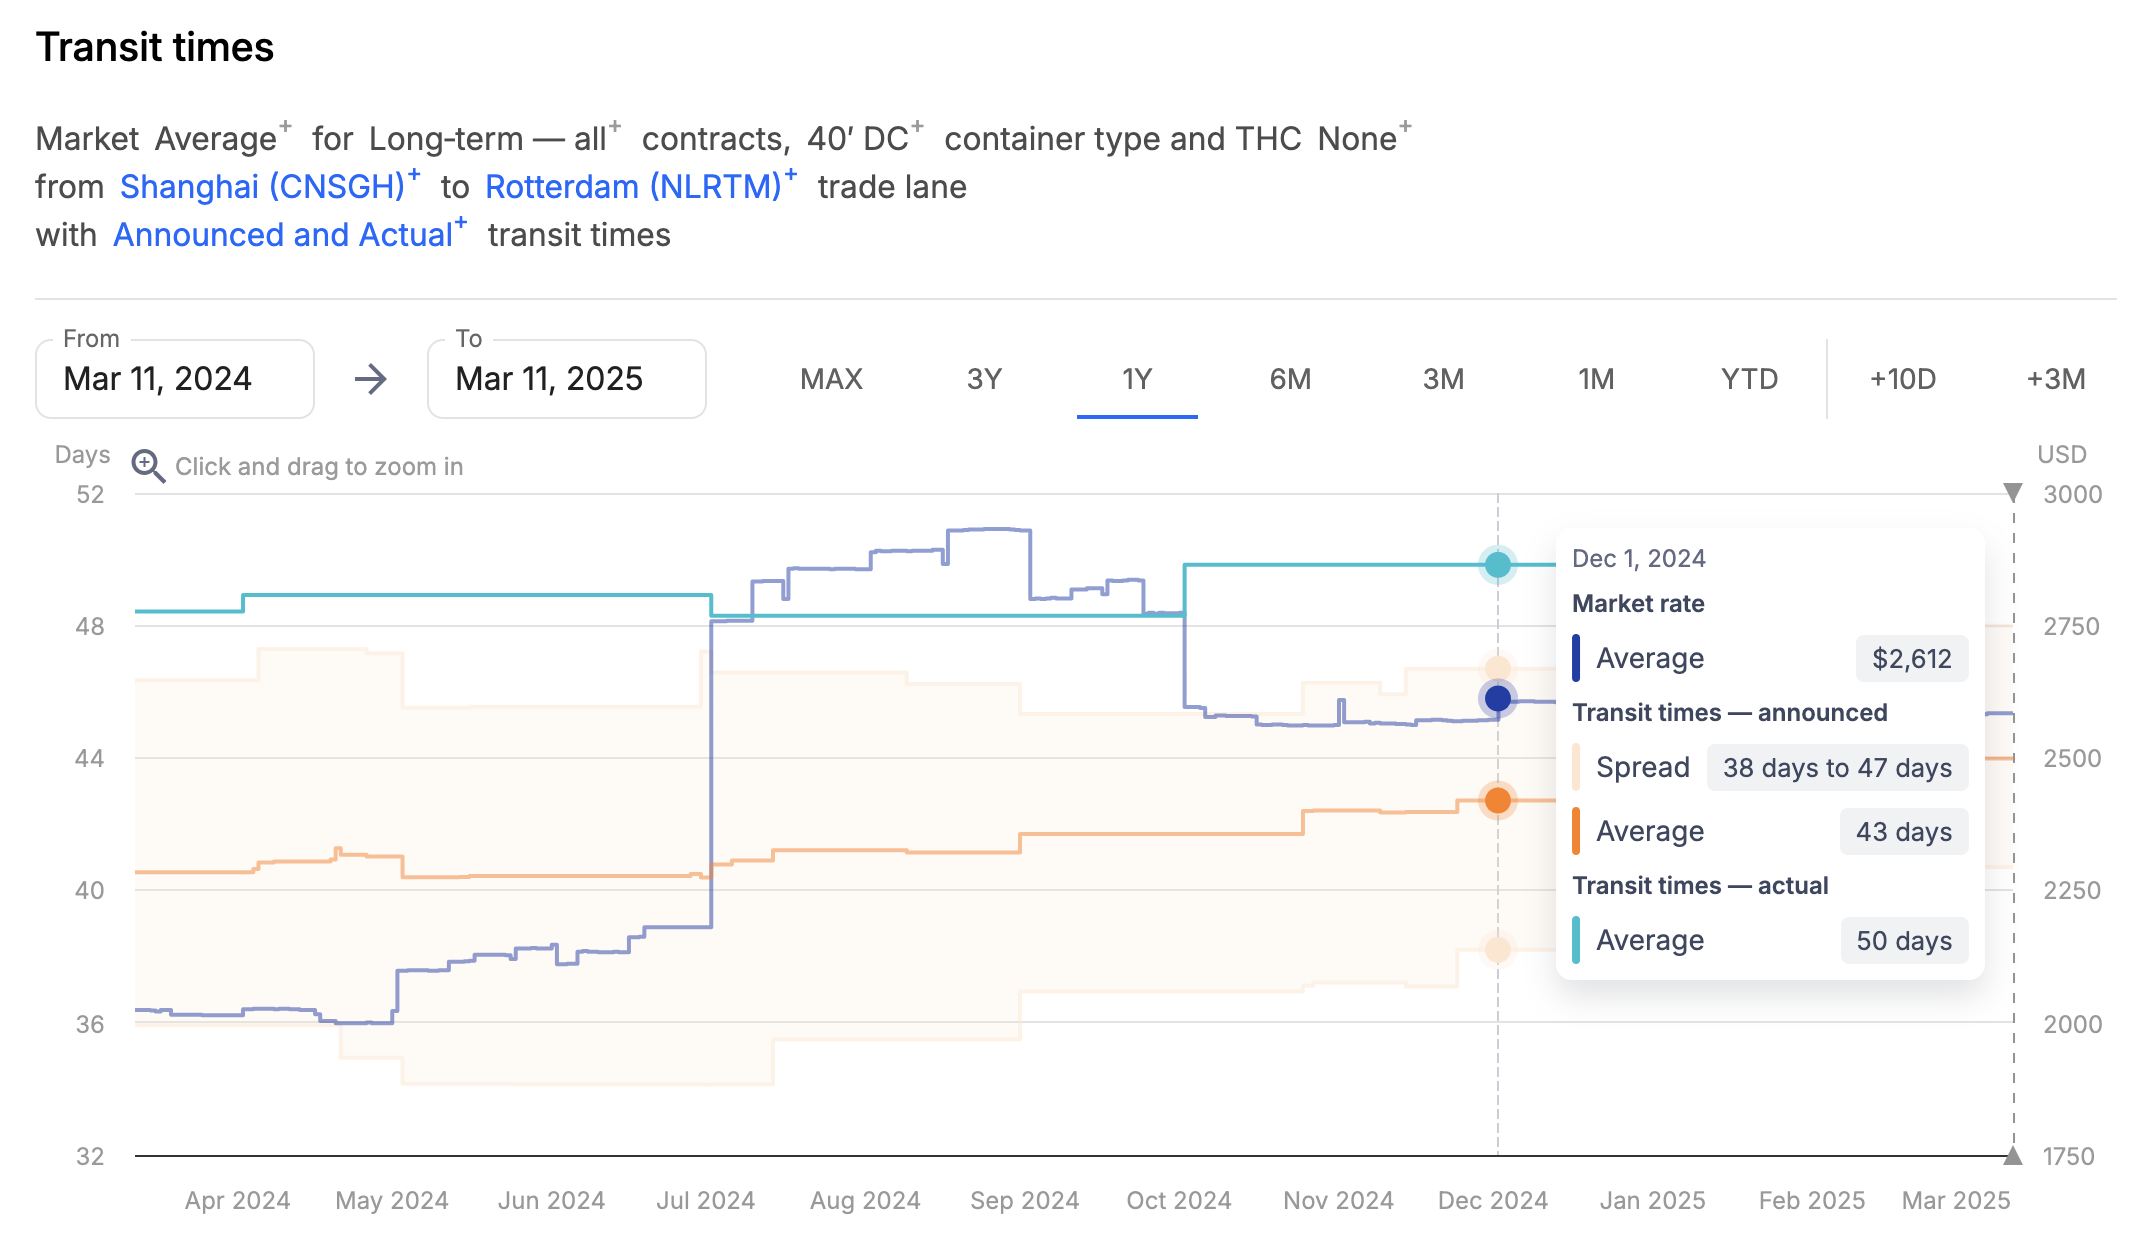
To learn more, see Transit times.
View detention and demurrage
Switch to Detention and demurrage using Change dataset to access the data on the free days before detention or demurrage charges available at the ports within your selected origin (export) and destination (import):
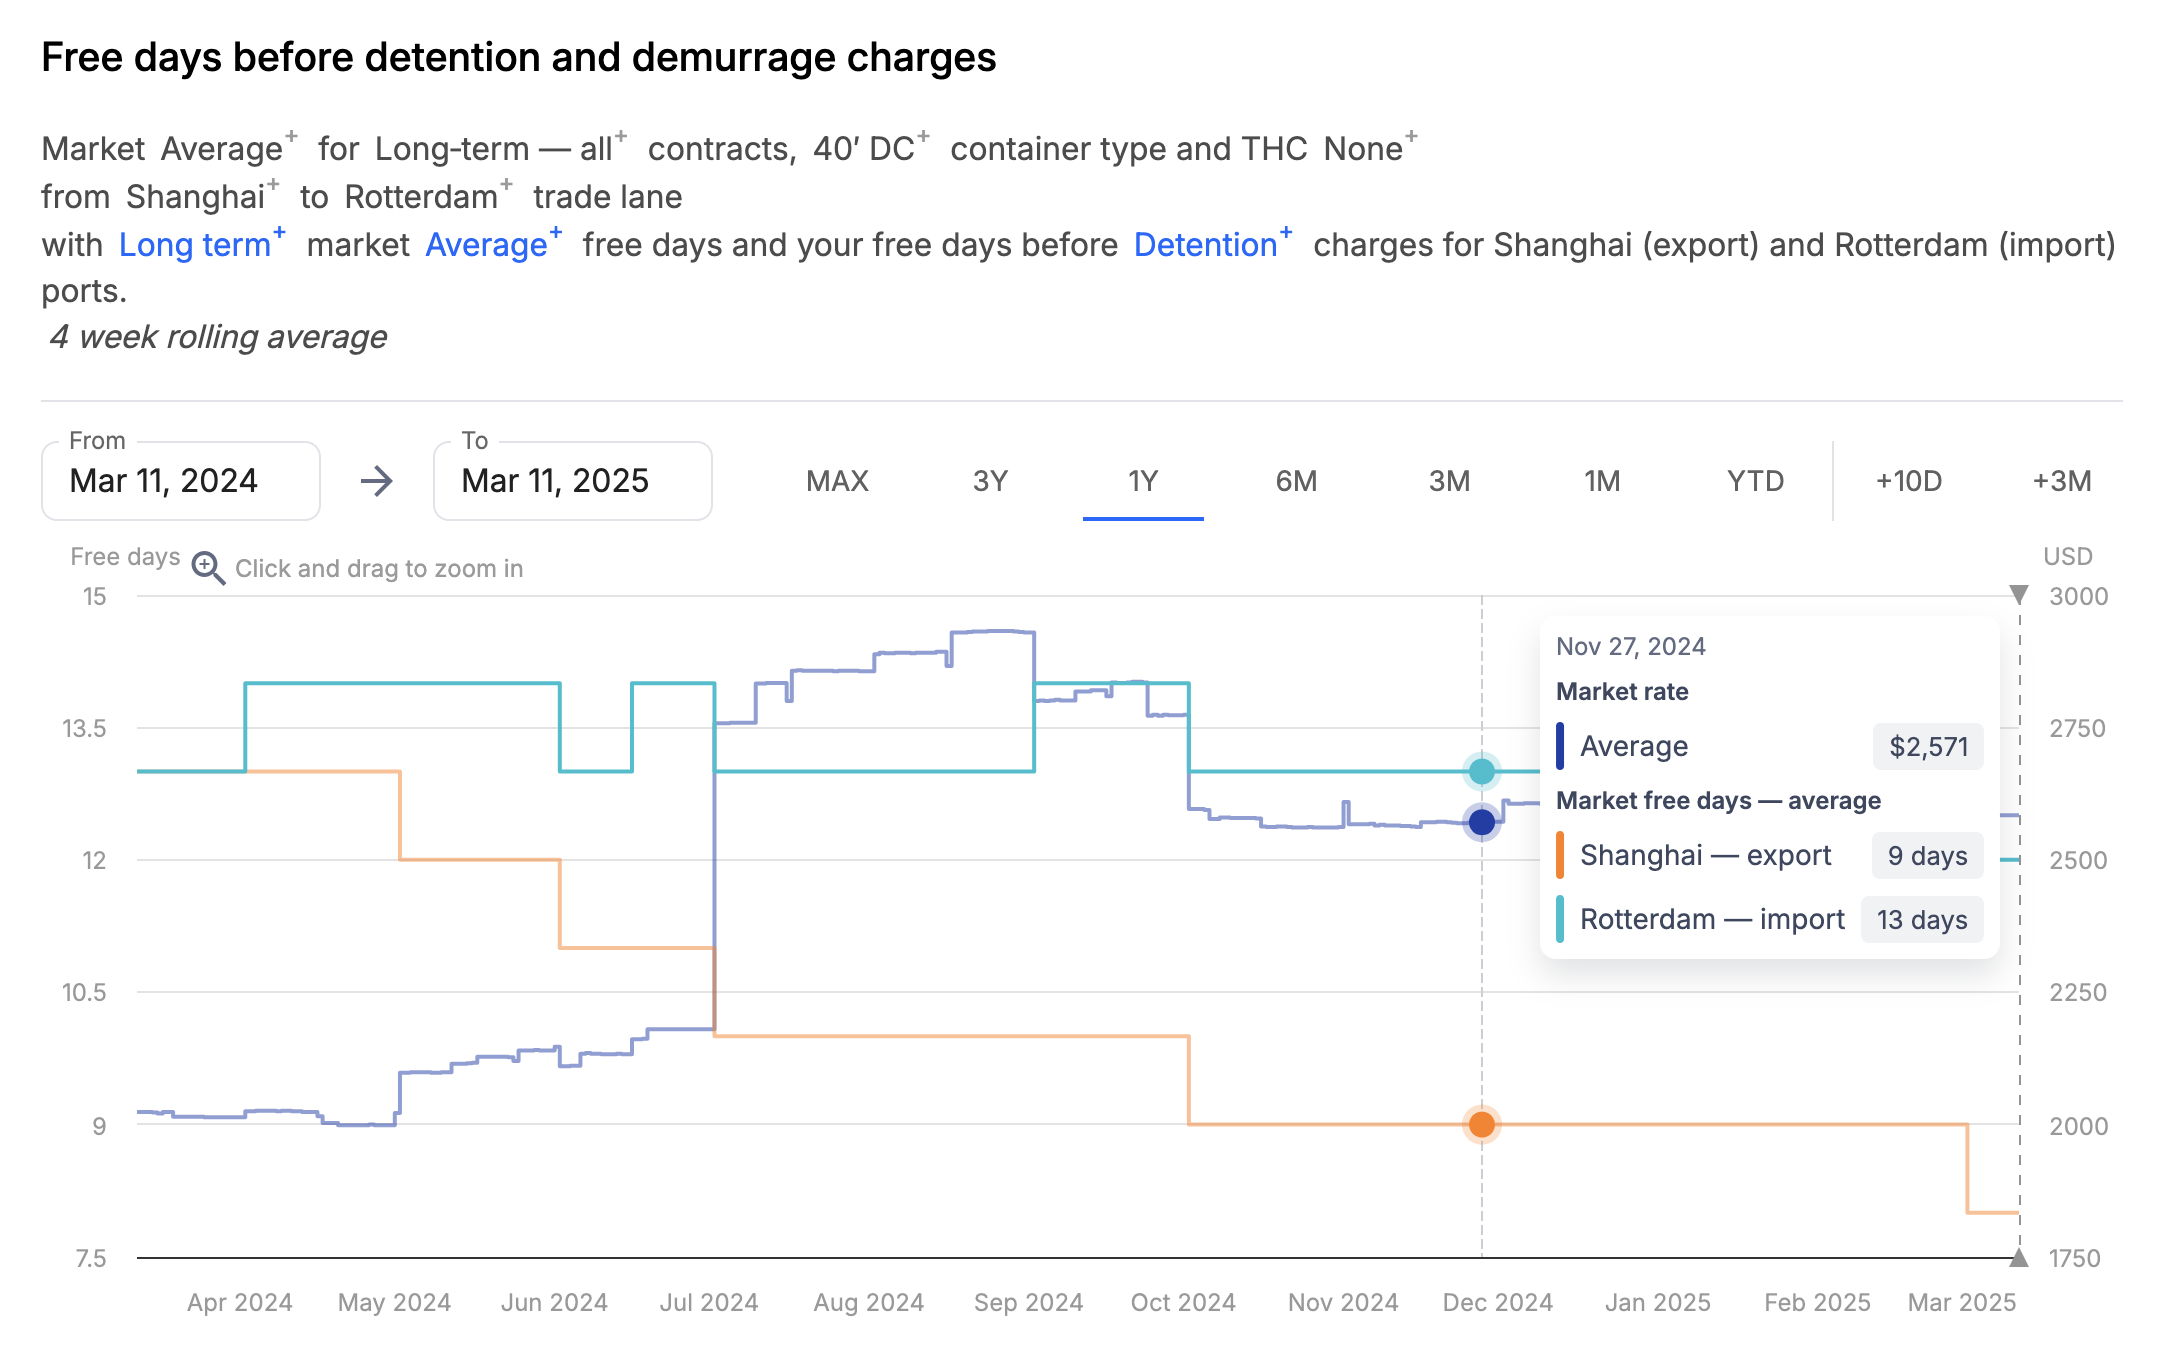
To learn more, see Detention and demurrage.
View carbon emissions
Select Carbon emissions in the Change dataset menu to access the indexed view of carriers' CO2 performance and see how it compares to the average and changes over time on the market's largest trade corridors:
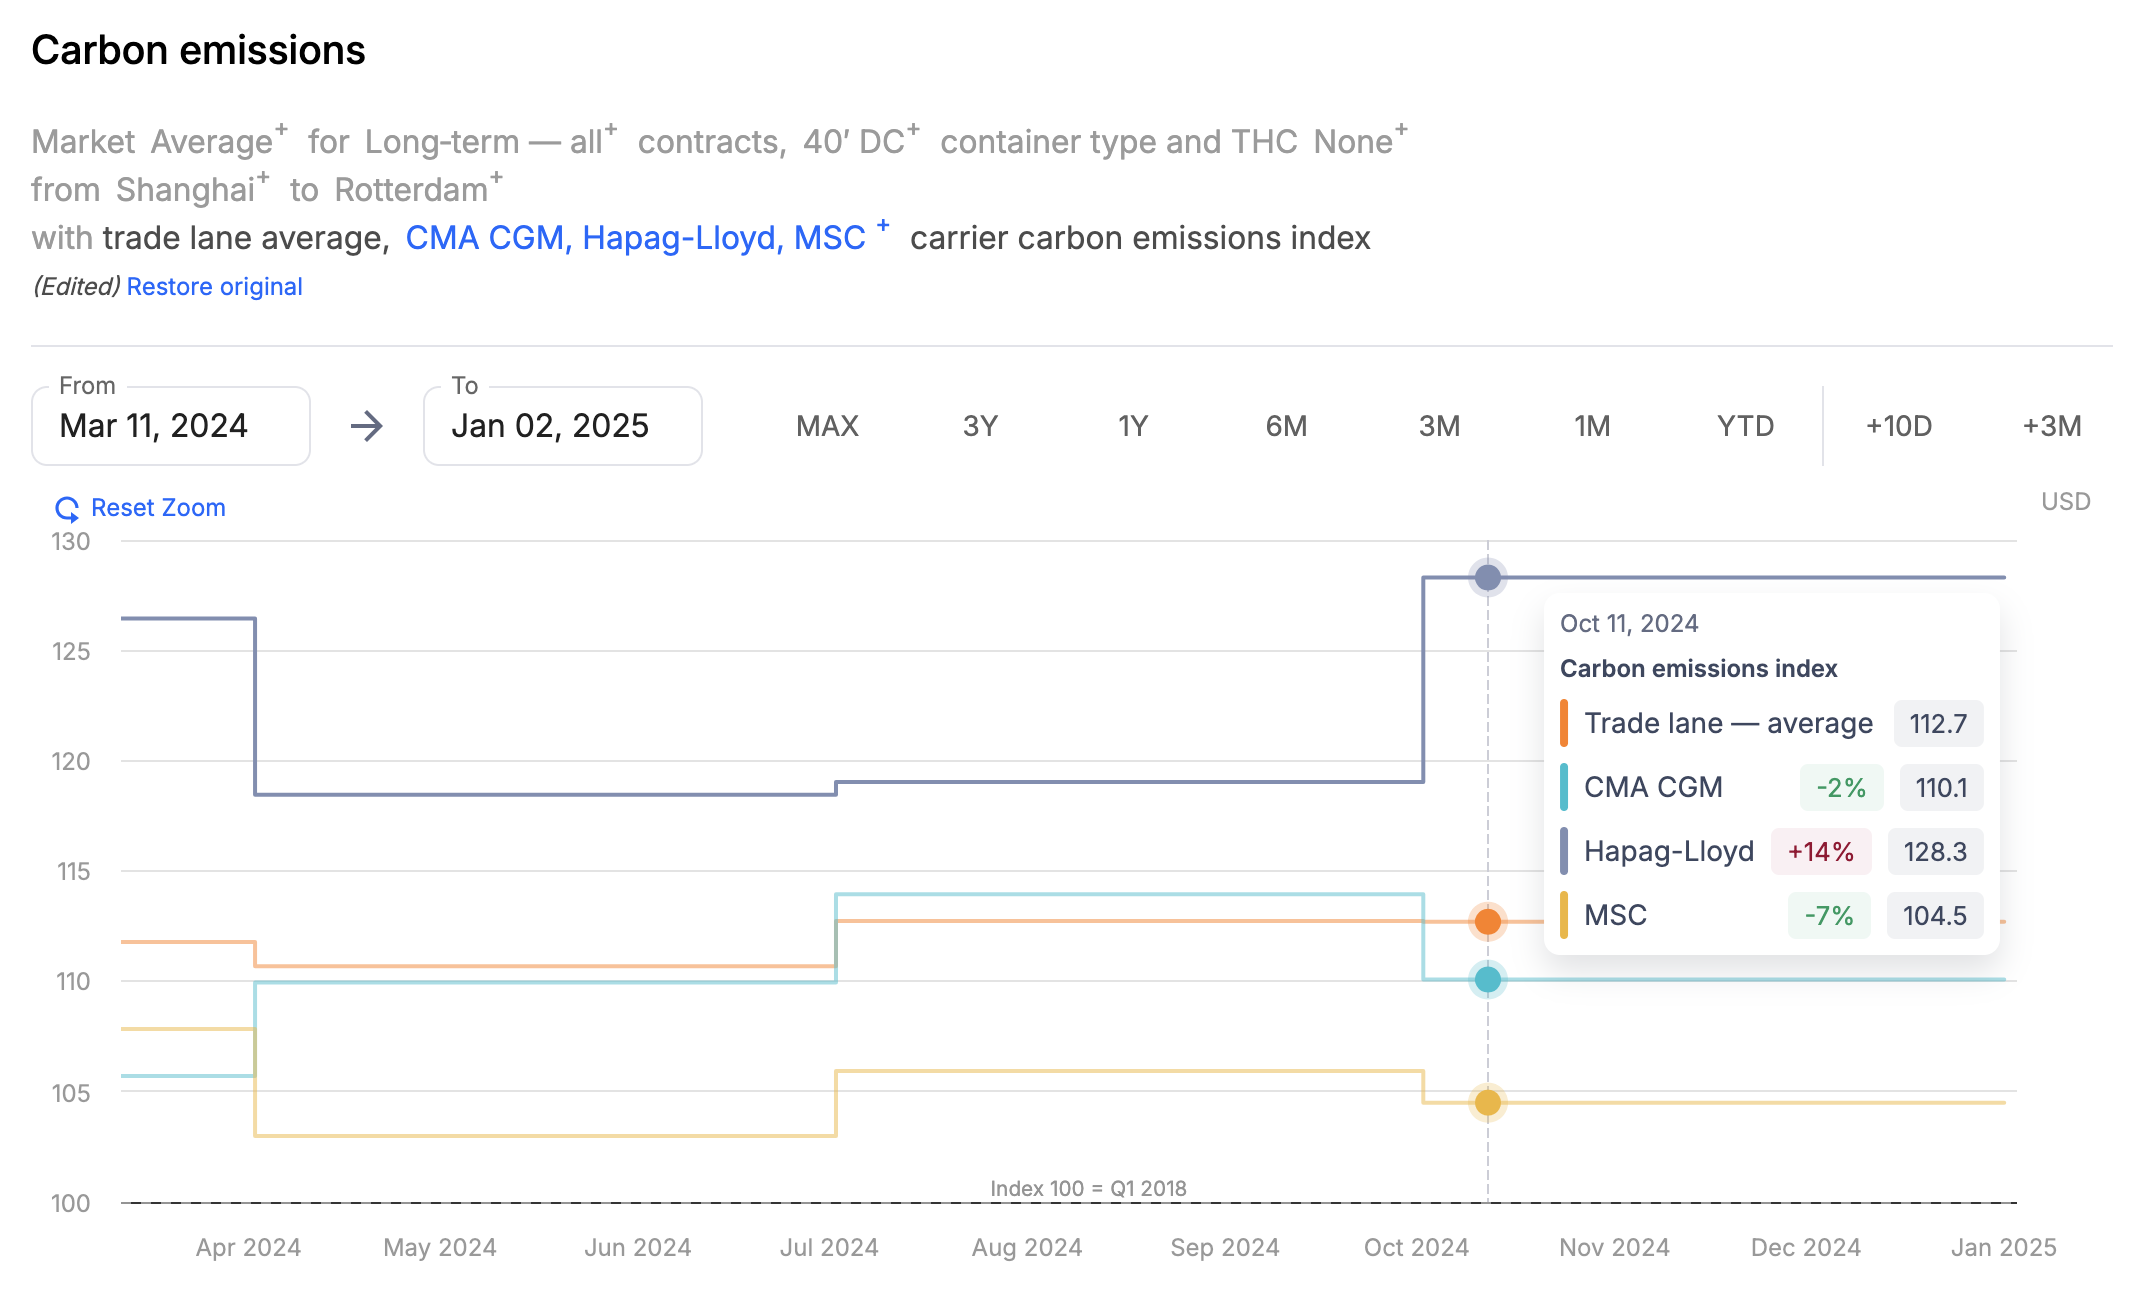
To learn more, see Carbon emissions.
View surcharges
Switch to Surcharges in the Change dataset menu to see the historical historical development of select major surcharges imposed by ocean carriers across the largest global trade corridors:
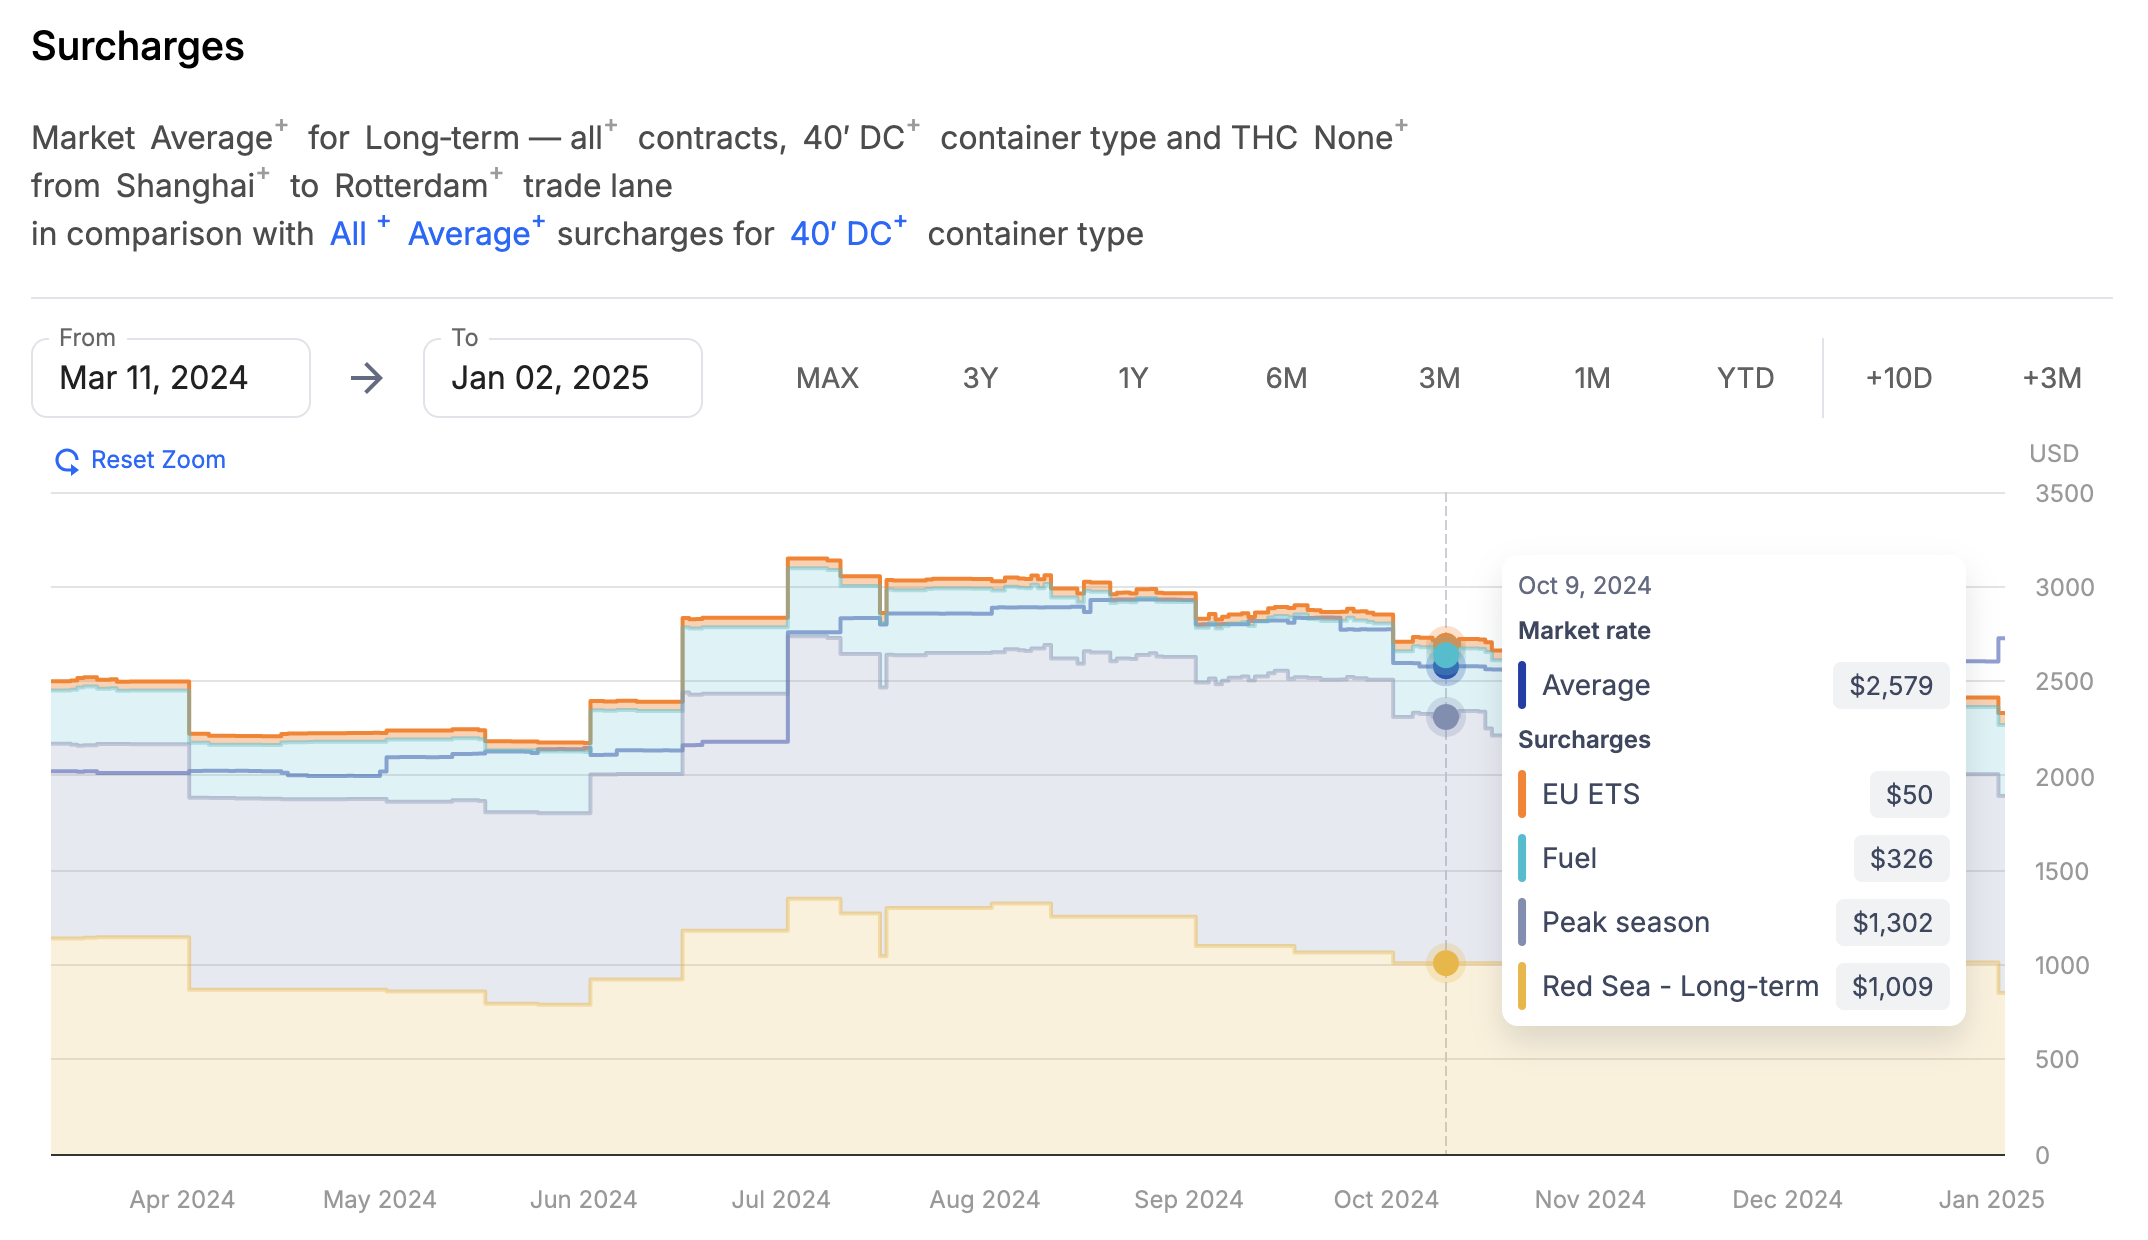
To learn more, see Surcharges.
Access highlights and insights
Highlight and Insight sections provide dynamic data-driven commentary that aims to inform you on the current state of the market and your position within it:
To learn more, see Highlights and insights.
Updated 4 months ago