Cancellation rates
Cancellation rates show the proportion of scheduled sailings that were cancelled, helping you monitor market disruptions and evaluate carrier reliability on your selected trade lanes. It indicates the share of planned port calls that did not take place. It is available on an aggregated level and down to individual carrier-level between port-pairs.
This includes three types of cancellations identified in eeSea data:
- Skipped sailings — regularly omitted sailings due to service rotation (e.g., a 35-day service operating four vessels, leaving one week without a voyage).
- Omitted sailings — port calls that were removed from a planned voyage.
- Blanked sailings — entire voyages that carriers decided to cancel.
These cancellations are tracked continuously using eeSea, a Xeneta company that gathers data directly from carrier schedules and AIS-based vessel tracking for unbiased, high-frequency updates.
Why it matters
Monitoring Cancellation Rates allows you to:
- Identify capacity disruptions caused by increased blank sailings.
- Assess carrier performance and planning consistency.
- Anticipate market tightening when cancellations rise across a corridor.
- Combine with Schedule Reliability and Capacity to gain a full operational picture of market stability.
View cancellation rates
You can access Cancellation Rates in three areas of the Xeneta platform:
Market Benchmarks
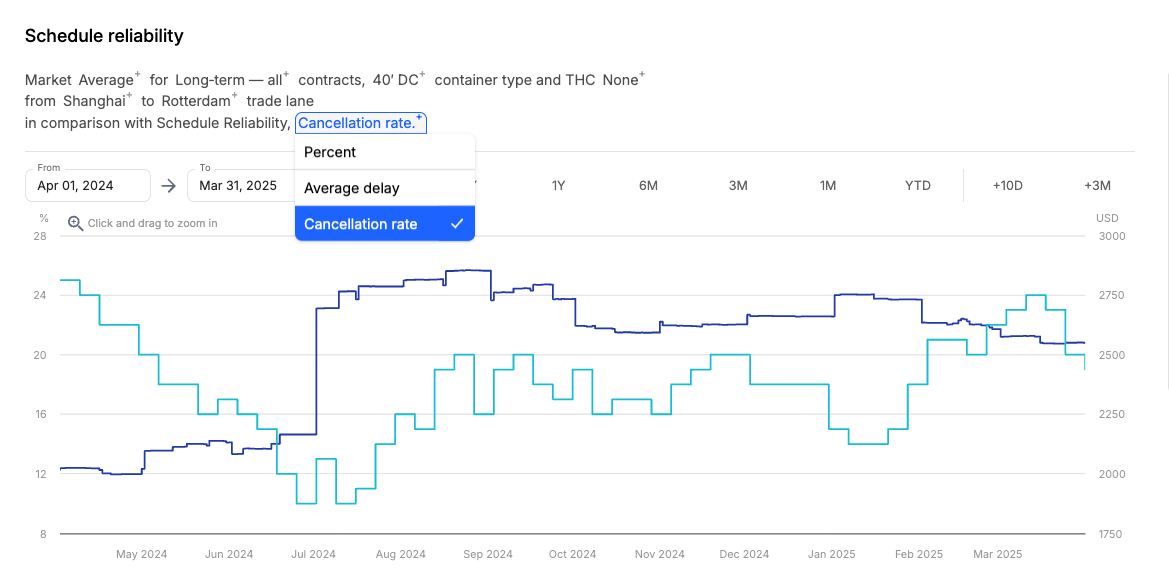
To access the cancellation rates data, go to the Market benchmarks page and select Reliability in the Change dataset menu — the graph with market rates for the selected origin and destination will be updated with the information on average reliability on that corridor.
By default, the reliability data is displayed in percent values. Switch it show cancellation rates (in %)
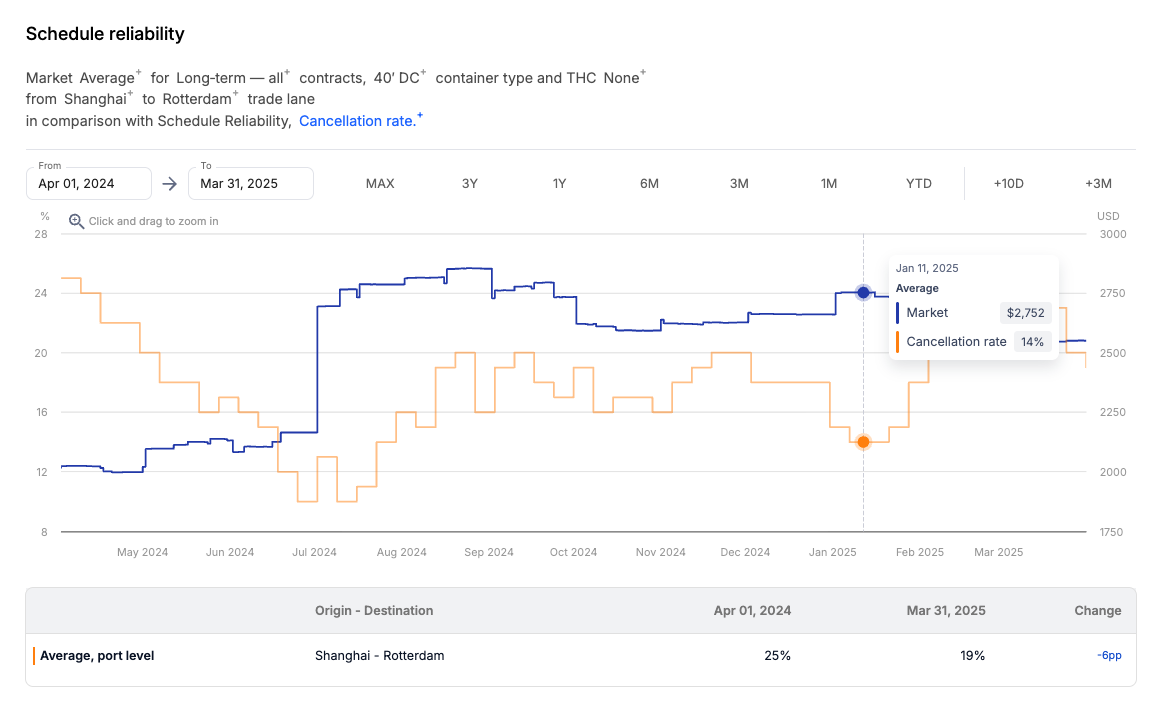
Cancellation rate (under Reliability)
Aggregate level
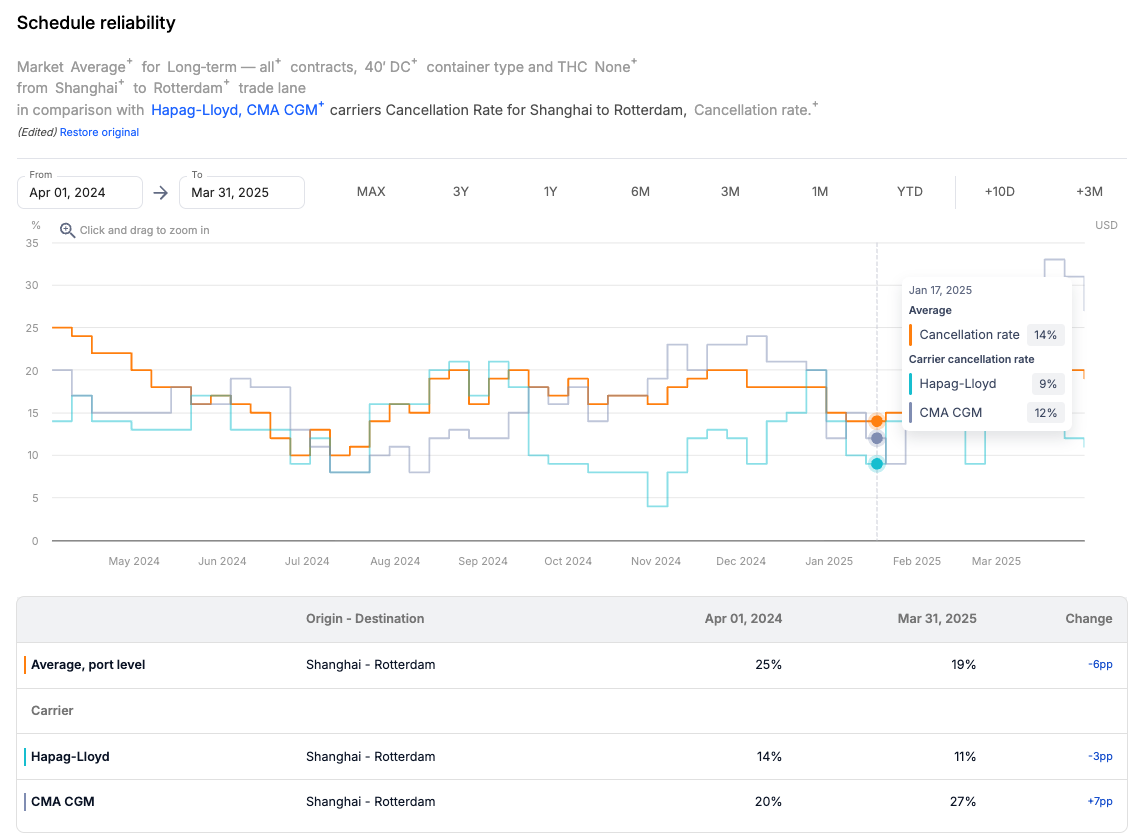
Carrier level
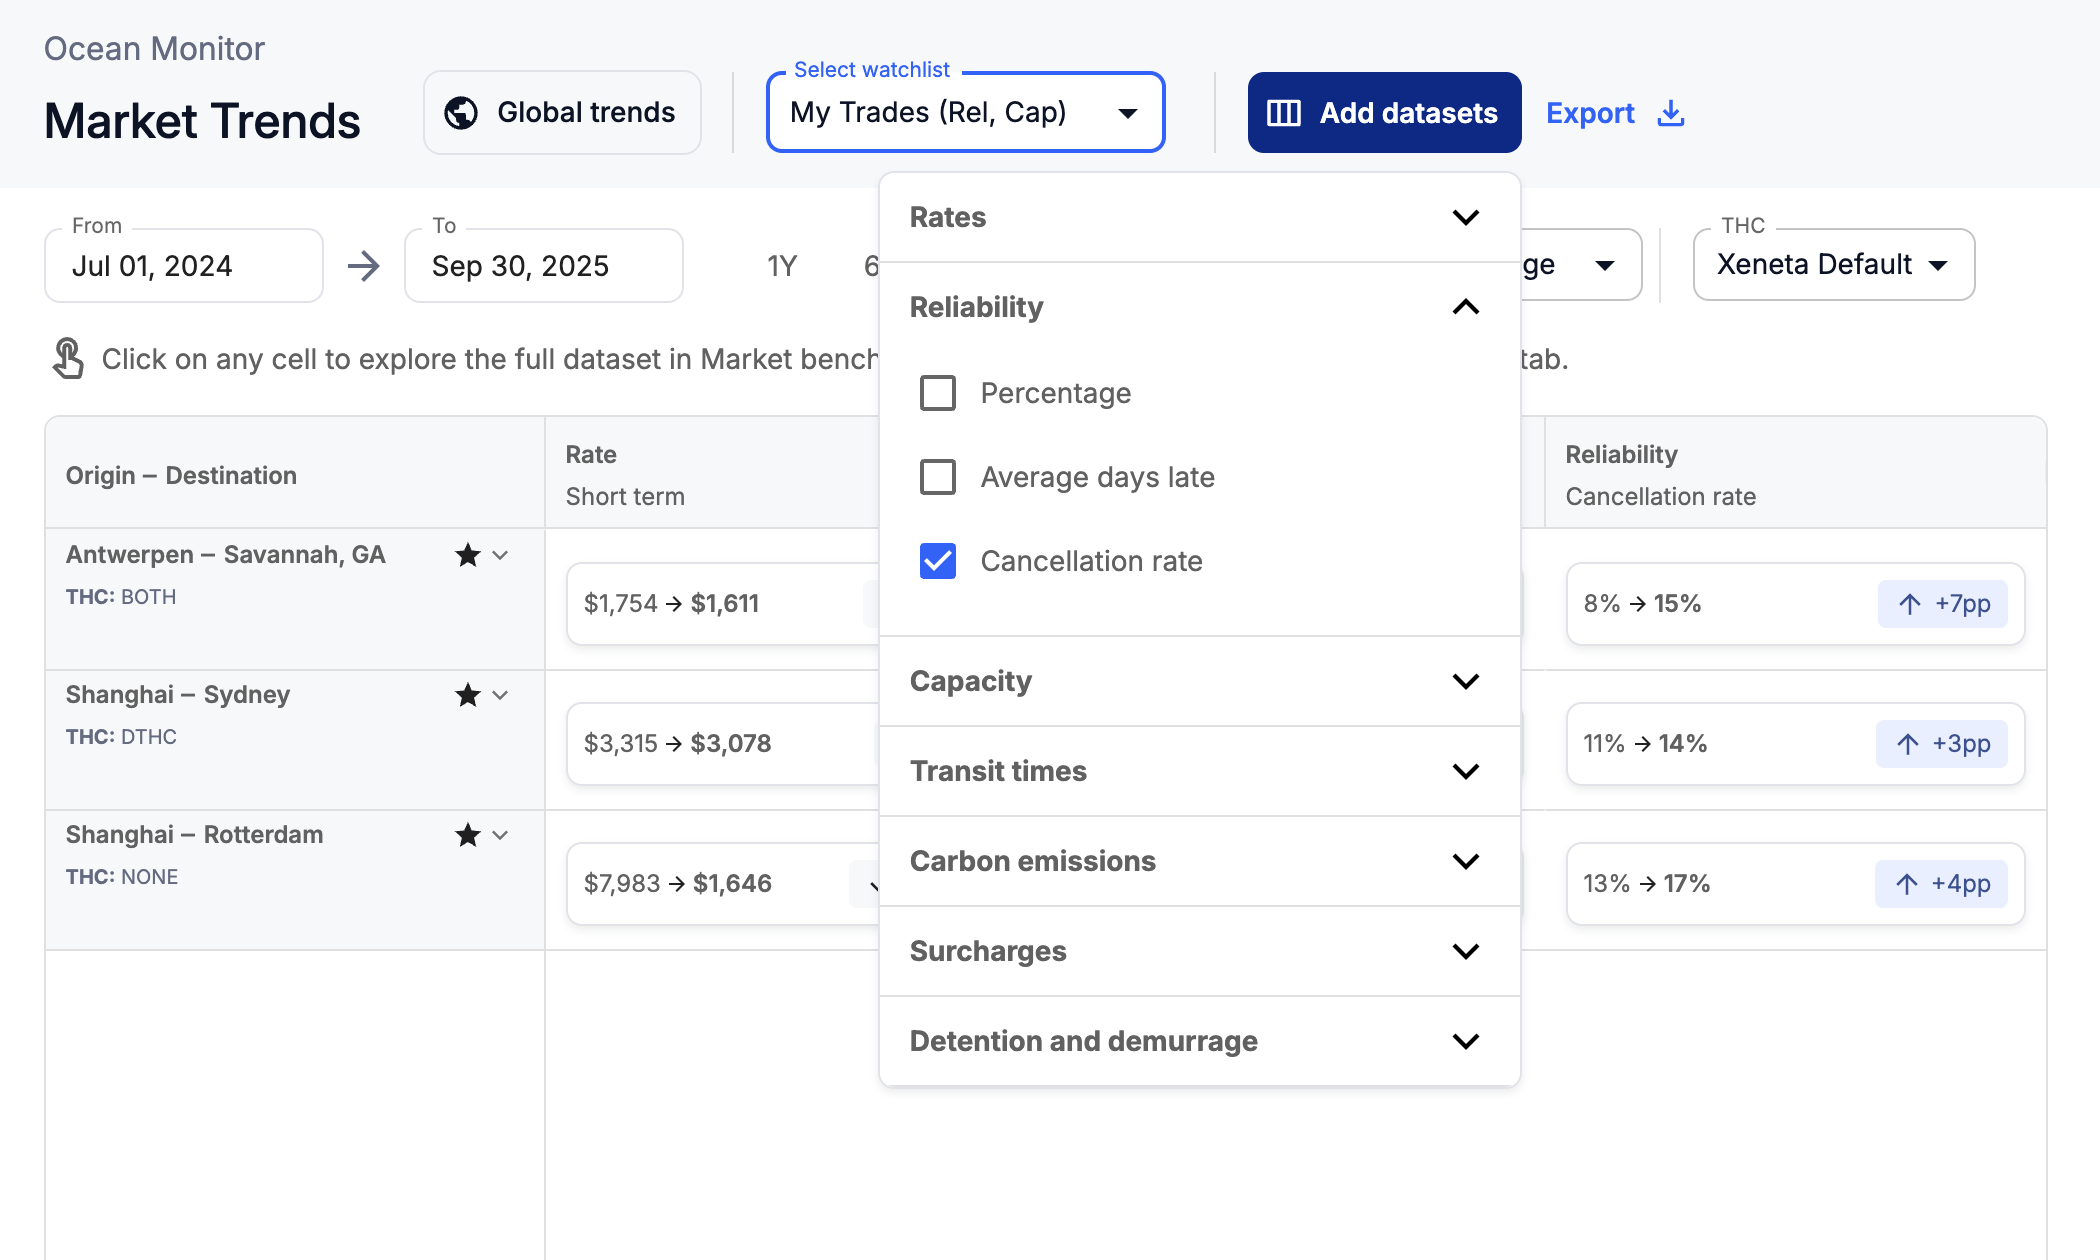
Market Trends
Add datasets under Schedule Reliability to evaluate disruptions between a portfolio of lanes in the Market Trends view
Carrier Comparison Scorecard
Add it in your scorecard calculation to evaluate carrier performance alongside reliability, capacity, and cost metrics.
Cancellation rates methodology and calculation
The Cancellation Rate is calculated as:
(Number of cancelled port calls ÷ Total scheduled port calls) × 100
To ensure stable and meaningful results, Xeneta uses an 8-week rolling average for this metric.
This helps smooth out short-term volatility while maintaining responsiveness to recent changes in carrier behavior.
Data availability:
- The latest data on the platform is shown with a one-week delay, ensuring completeness and accuracy.
- For example, data shown on 29 September 2025 reflects cancellations up to 28 September 2025.
Updated 3 months ago