Capacity and load factor trends
The Capacity and Dynamic load factor view in Market trends provides a detailed insight into current and historical air freight market capacity and load factor changes, and allows you to see how they correlate with long-term market rates on the largest global corridors.
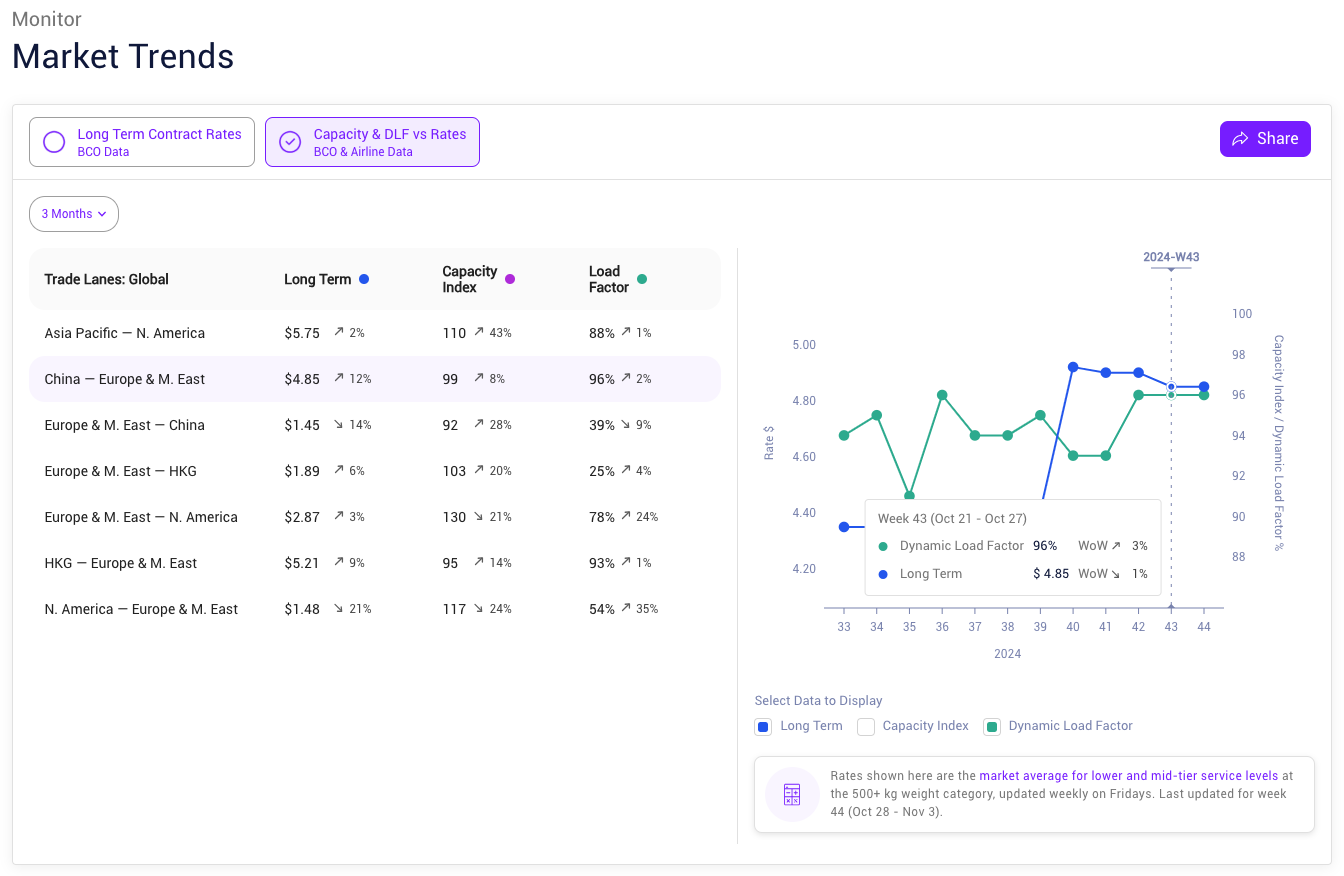
Load factor, capacity, and rate data is provided by Xeneta's subsidiary CLIVE Data Services and is updated weekly.
Supported trade lanes
Xeneta's air market capacity and load factor data is available for seven key global trade corridors:
- Asia Pacific – North America
- China – Europe and Middle East
- Europe and Middle East – China
- Europe and Middle East – Hong Kong
- Europe and Middle East – North America
- Hong Kong – Europe and Middle East
- North America – Europe and Middle East
Available data points
Depending on what data you want like to compare, you can select from up to three available data points to be displayed on the graph:
- Long-term rates — rates from contracts that are valid for more than 87 days
- Capacity index — available capacity on the air freight market on the selected trade lane during a given week
The Capacity index reference value of 100 is based on the average value for the calendar weeks 10–13 of the year 2019.
- Dynamic load factor — capacity utilization on the selected trade lane, representing the amount of cargo that was actually flown in either weight or volume (whichever is the highest) during a given week
This allows you to quickly and dynamically compare between different types of data for your selected trade lane and see the correlation between dynamic load factor and capacity, or between capacity and long term rates.
How to read capacity and load factor data
To understand how to read the capacity and load factor data on the graph, let's take a look at a few examples.
Capacity
If the index is at 60% during a specific week, that means that there was 40% less cargo capacity available on the air freight market compared to the average, “normal” amount:
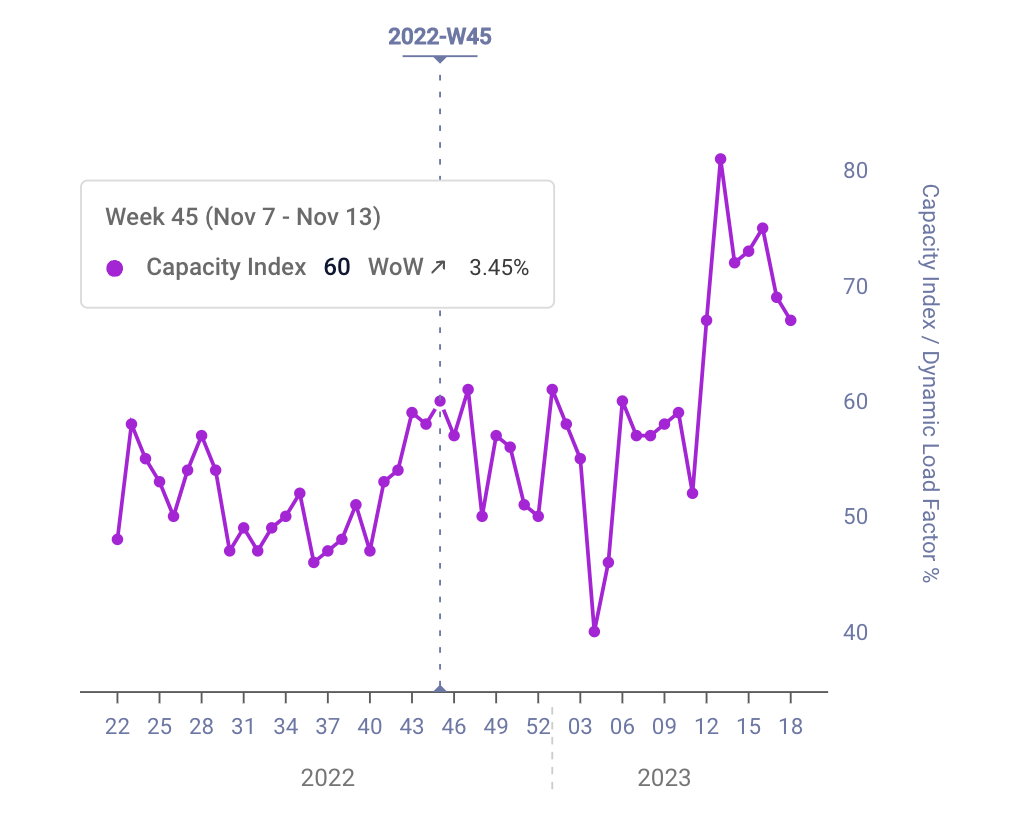
Capacity index on Europe and Middle East – Hong Kong
The opposite is also true — for example, if you see 130% capacity, that means that the market had 30% more space available for booking on that specific week:
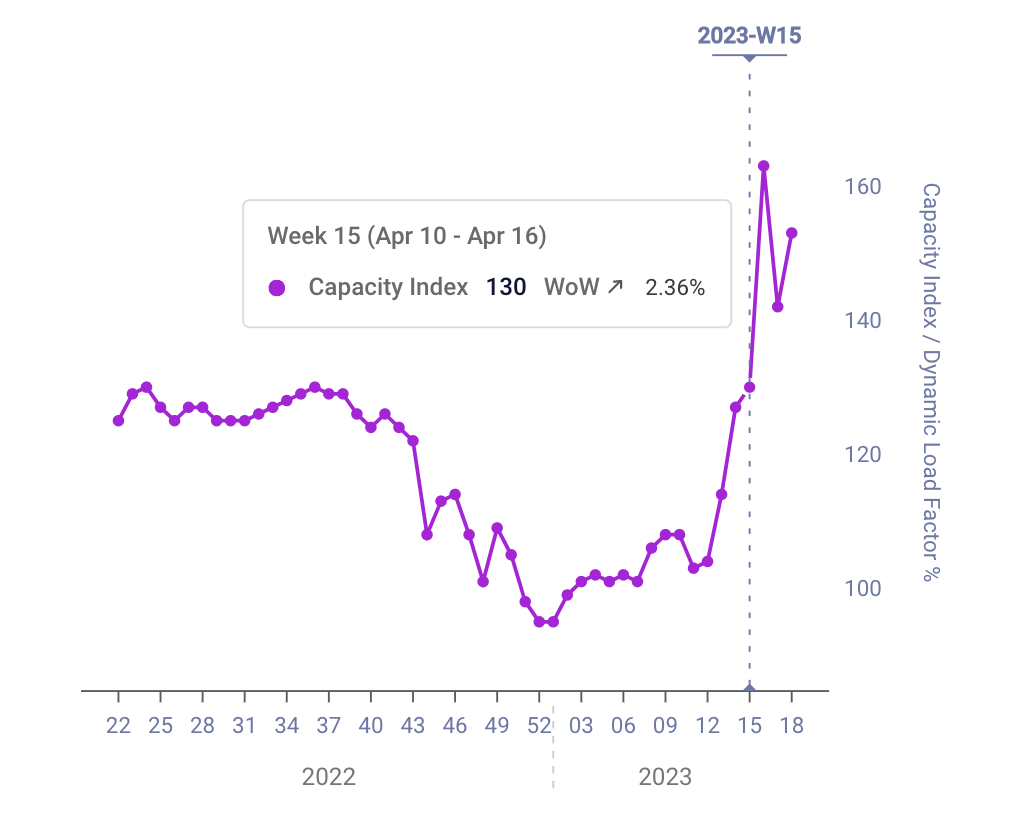
Capacity index on Europe and Middle East – North America
Dynamic load factor
The dynamic load factor value of 50% shows that the flights that took place during the selected week were on average only half-full:
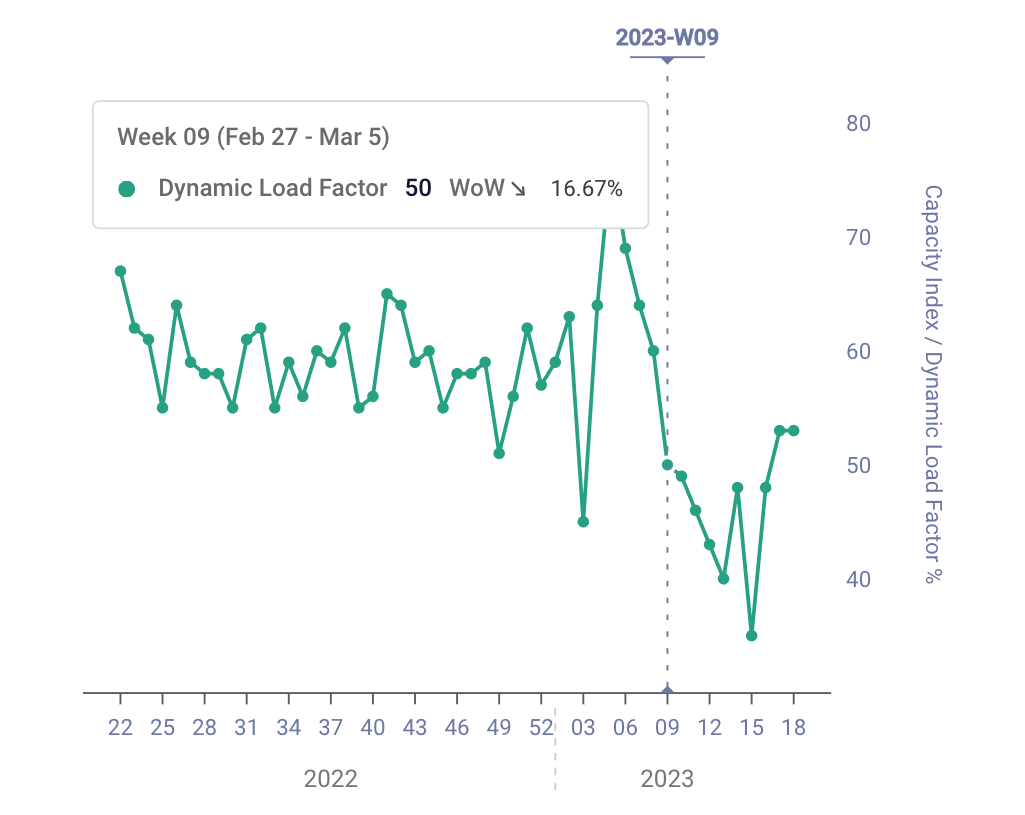
Dynamic load factor on Europe and Middle East – China
Updated 4 months ago