Schedule reliability
Schedule reliability is a collection of market data that shows the sailing reliability of ocean carriers on a port-pair level and is available on the Market benchmark and Market Trends pages.
Xeneta offers an overview of offered market capacity, as well as information on the schedule reliability of individual carriers.
It measures the percentage of vessel arrivals that occur on time, relative to the originally promised schedule and reflects how dependable carriers are at keeping their commitments. Reliability is measured at the destination port. The data is now available at port-pair level, and not just region-to-region. It updated daily, and is shown as a weekly figure based on an 8-week rolling window.
We source our Schedule Reliability data from eeSea, a Xeneta company.
View reliability data
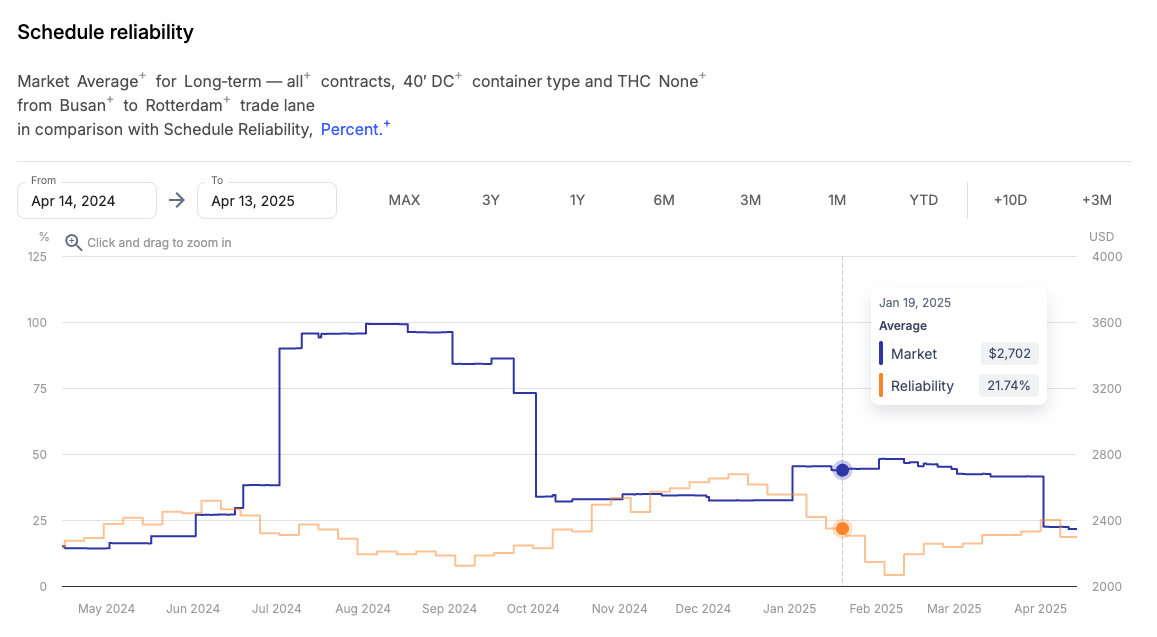
To access the schedule reliability data, go to the Market benchmarks page and select Reliability in the Change dataset menu — the graph with market rates for the selected origin and destination will be updated with the information on average reliability on that corridor:
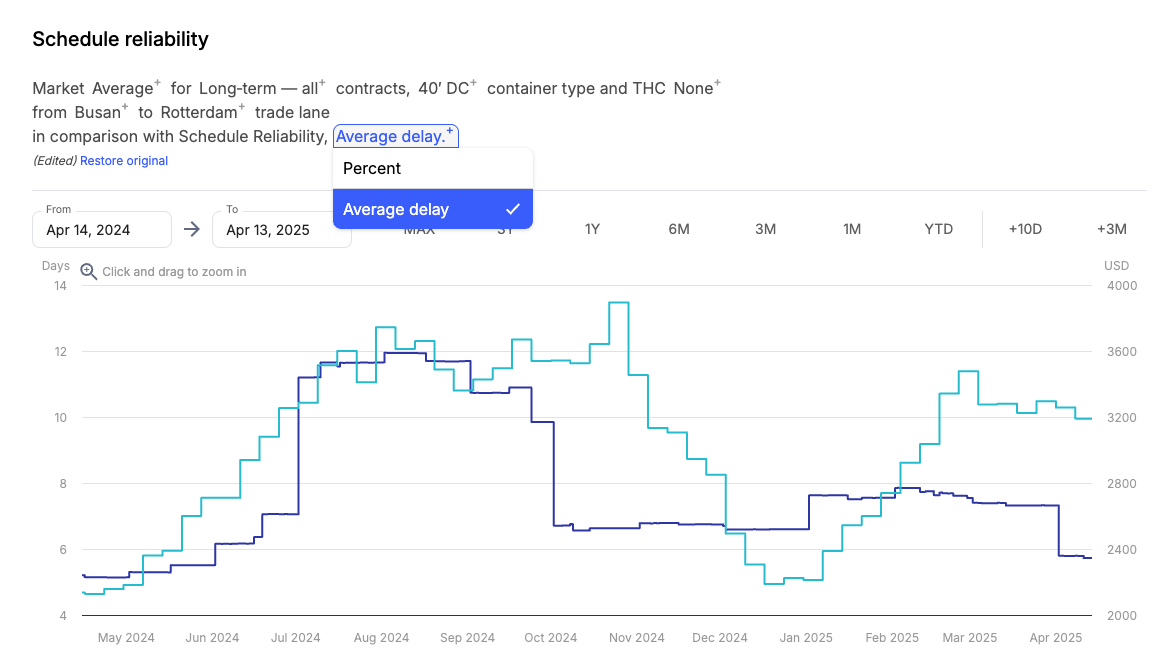
By default, the reliability data is displayed in percent values, but you can switch it to show average delay (in days) — in other words, the average amount of time the vessels arrived outside of their regular ETA if they arrived late. Note that early arrivals are not counted as a positive gain against delays, they are null:
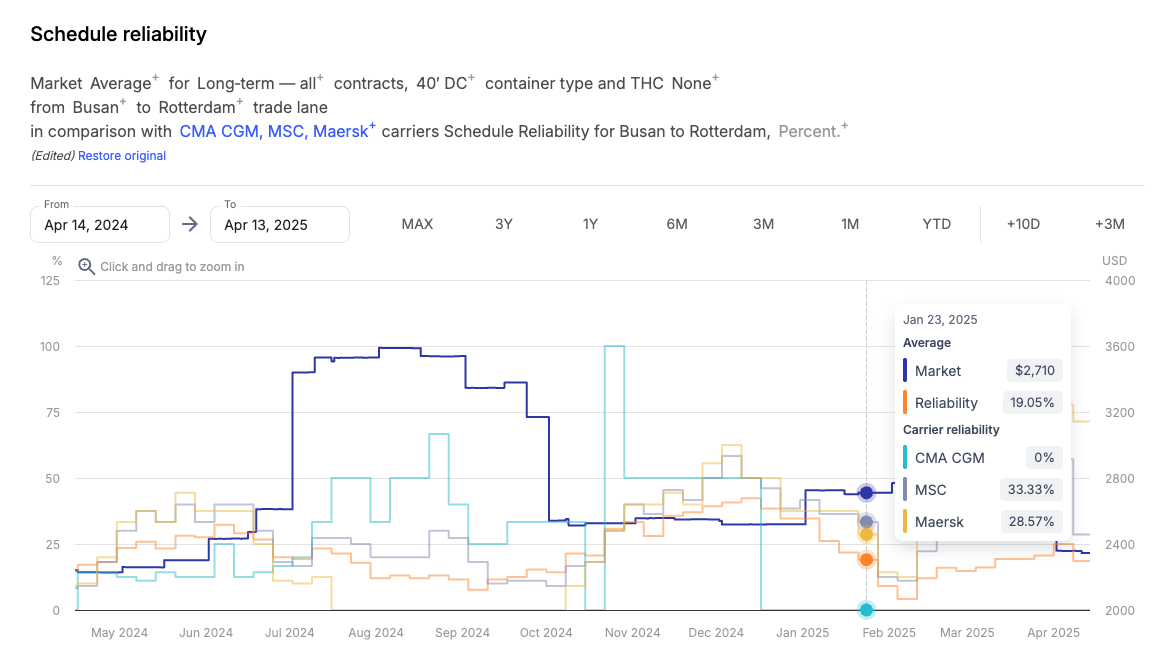
If you want to see individual carrier performance, click on the Add comparison button to the right of the graph, and then go to Carrier reliability > Carrier to select individual carriers:
Schedule Reliability can also be seen across multiple port-pairs together with other datasets in Market Trends.
Reliability data for individual carriers is available in percentage values only.
Reliability methodology and calculation
Reliability data is based on a methodology that relies on neutral vessel arrival time information collected from terrestrial and satellite AIS data. The proforma schedules against which on-time percentage is measured are collected and verified across multiple sources, including:
- Long-term and short-term carrier voyage schedules
- Carrier flyers and advisories
- Terrestrial and satellite AIS data
- Port schedules
The scheduled ETA is derived from the proforma schedules originally published by carriers.
A vessel is considered on time if it arrives with one calendar day before or after its scheduled ETA.
This data is then used to calculate the reliability scores (in %) shown in the platform based on a simple formula:

In other words, if a service calls ten ports on its journey and only six of those calls are on time, then the schedule reliability for that specific service will be 60% (6/10*100).
These individual service reliability figures are then combined to calculate the average reliability performance across the corridor that they operate on.
The Schedule Reliability numbers may appear lower than before, due to the change in methodology adopted in the platform. The primary change is that carriers are now measured against their originally promised ETA, not on forecasted ETAs published regularly by the carriers. This closely reflects how dependable carriers are at keeping their commitments.
Updated about 1 month ago