Performance overview | Air
Performance overview is a page in the Analyze section of Xeneta's air freight platform that serves as a convenient dashboard that helps you keep track of your uploaded rates.
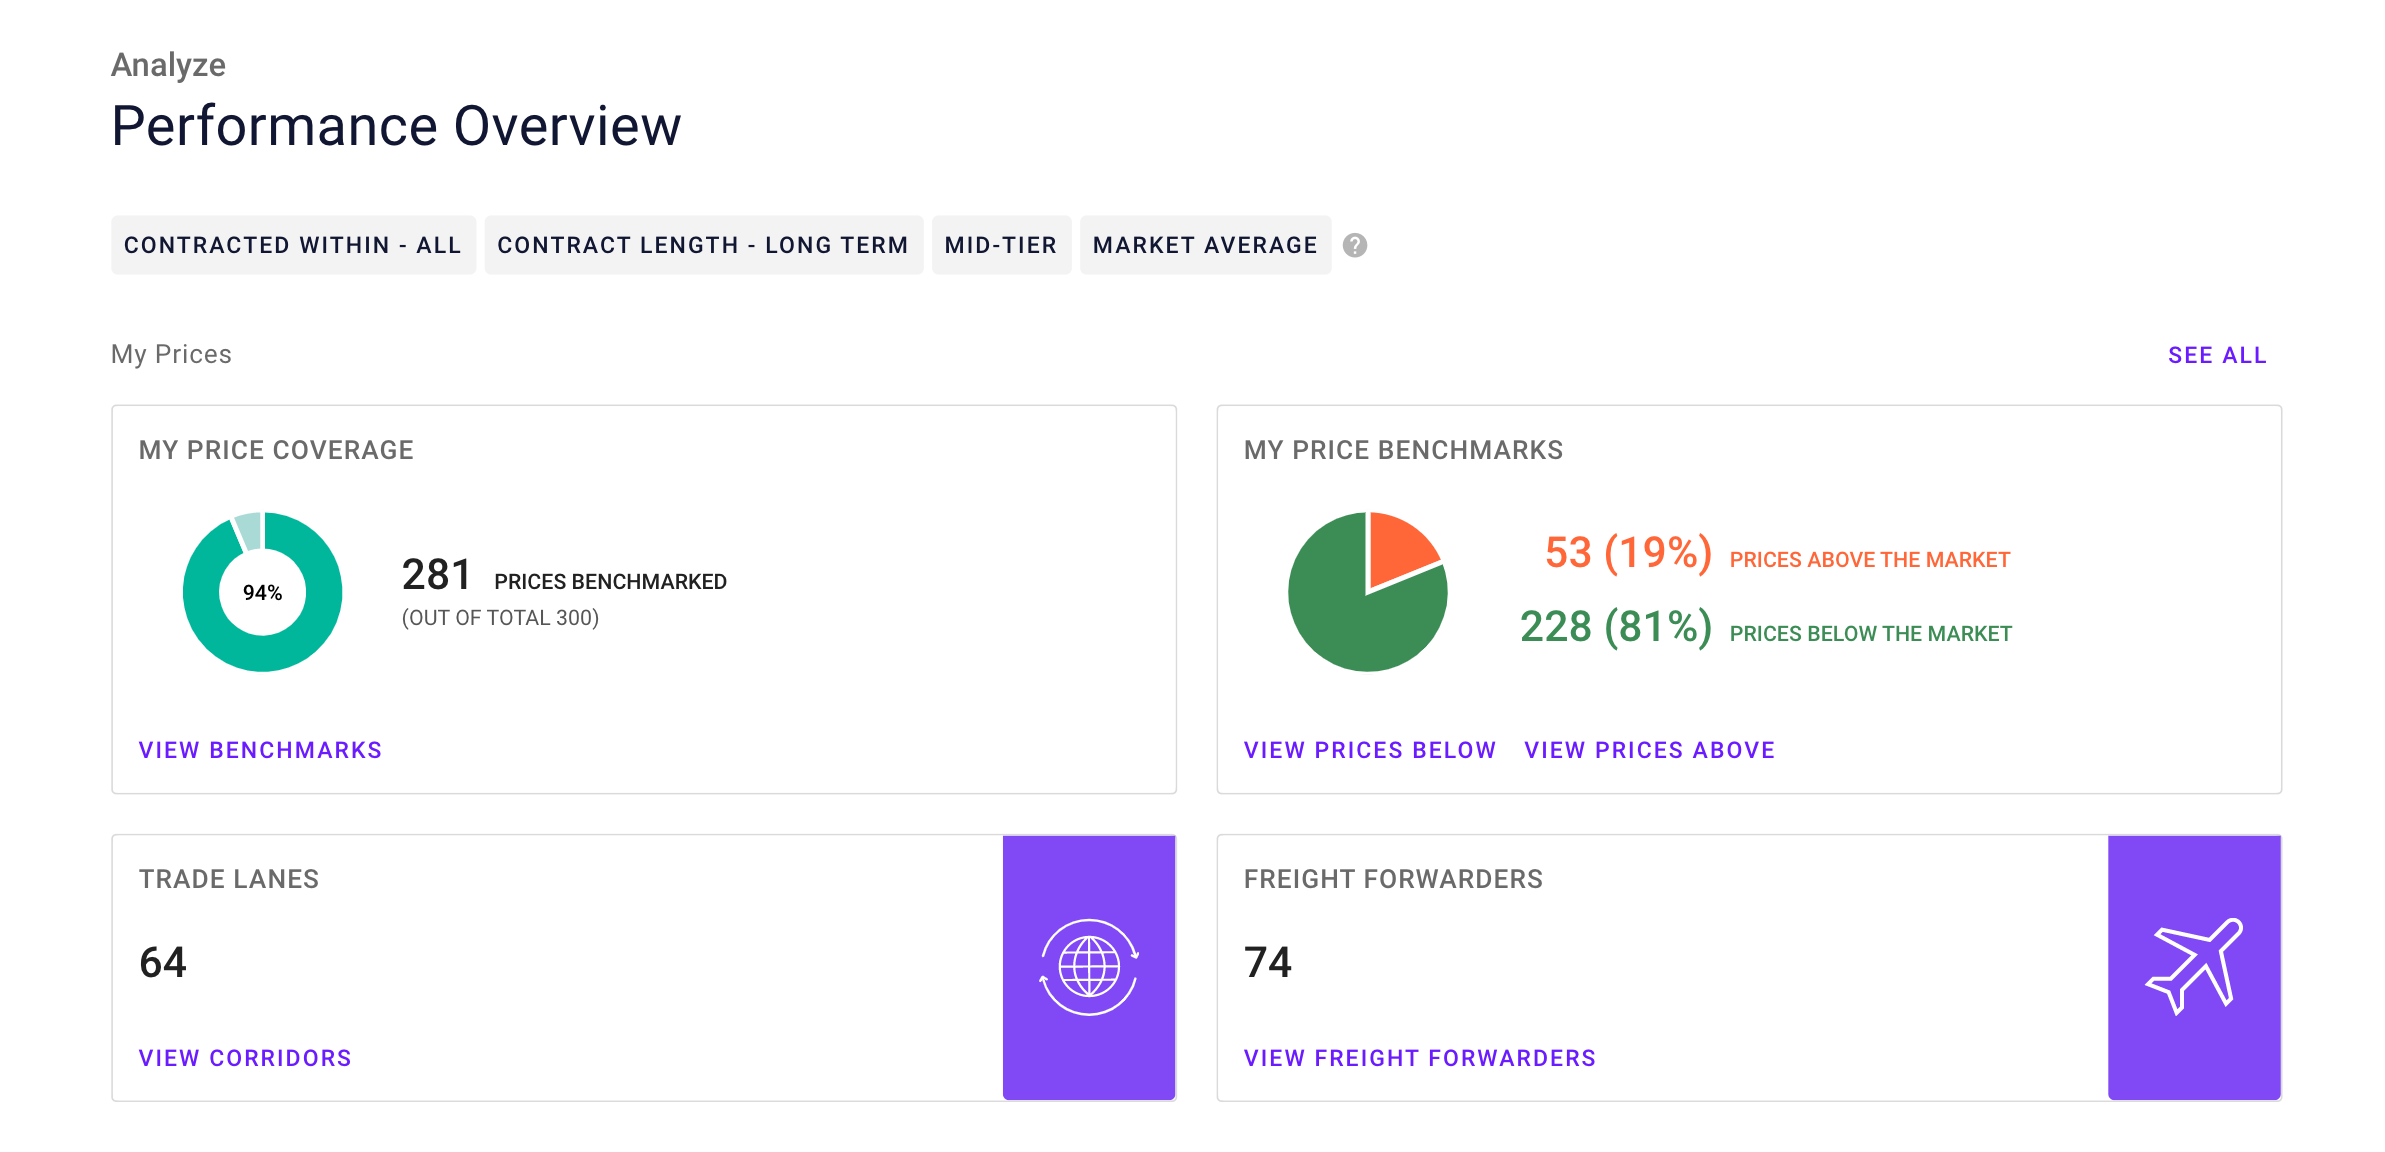
My prices
The most prominent feature in Performance overview is the My prices section that contains information on your uploaded rates and how they generally compare with the rest of the air freight market.
My prices provides the following indicators:
- My price coverage
- My price benchmarks
- Trade lanes and Freight forwarders data
My price coverage
My price coverage measures how many of your uploaded rates Xeneta can benchmark against comparable market rates.
If we can't benchmark one or several of your uploaded rates due to limited coverage or other issues, they will not be taken into account for the Prices benchmarked chart.
My price benchmarks
My price benchmarks shows how many of your uploaded rates are above and below your selected market segment. These values depend on your selected market position setting in the market metrics filters.
Trade lanes and Freight forwarders
These values represent the total number of airport-to-airport trade lanes and freight forwarding suppliers found in your uploaded rates.
Click See all to go to Price benchmarks and see a more detailed breakdown of your uploaded rates.
Updated 25 days ago