Capacity and blanked sailings
Capacity is a collection of market data available on Market benchmarks and Market Trends that provides a view of ocean freight market capacity and offers a detailed look into the amount of offered and blanked TEUs on the corridor level and down to the port level.
Xeneta offers an overview of offered and blanked market capacity, visible as a 4-week rolling average and 12-week forward window, as well as information on specific carrier alliances.
The data is available at port-pair level, and not just region-to-region. It updated daily, with history and a 3-month forward view. It provides consistency as Capacity excludes blanked sailings, omissions, and inducements.
We source our Capacity data from eeSea, a Xeneta company.
View capacity data
To access the capacity and blanked sailings data, go to Market benchmarks and select Capacity in the Change dataset menu — the graph with market rates for the selected origin and destination will be updated with the information on offered market capacity:
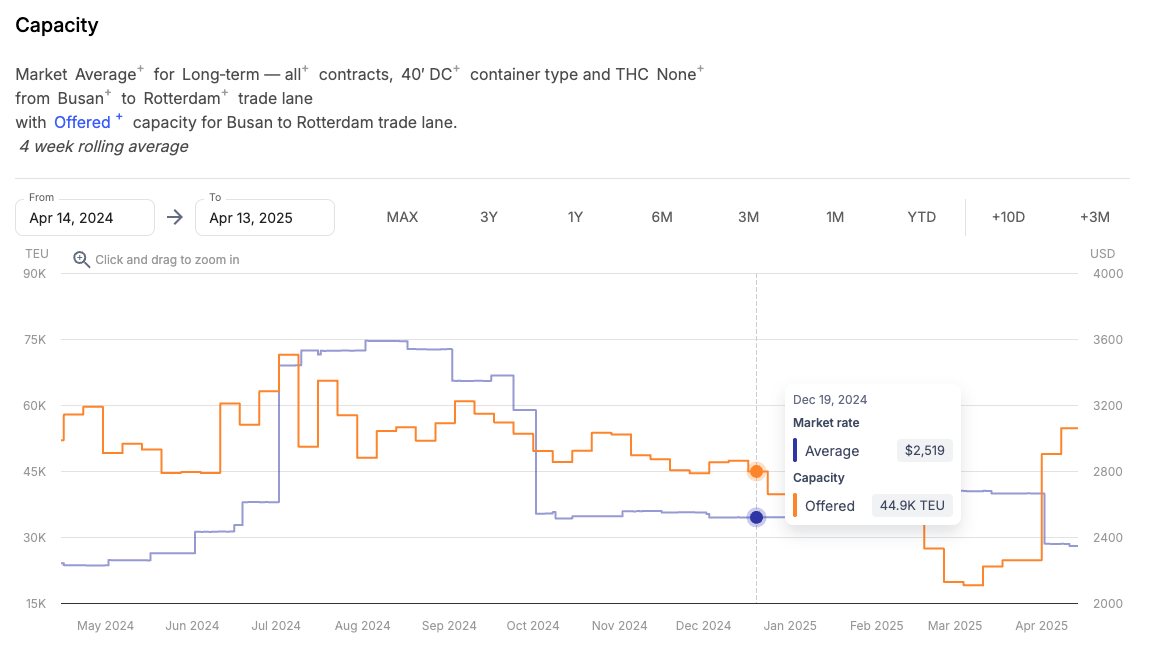
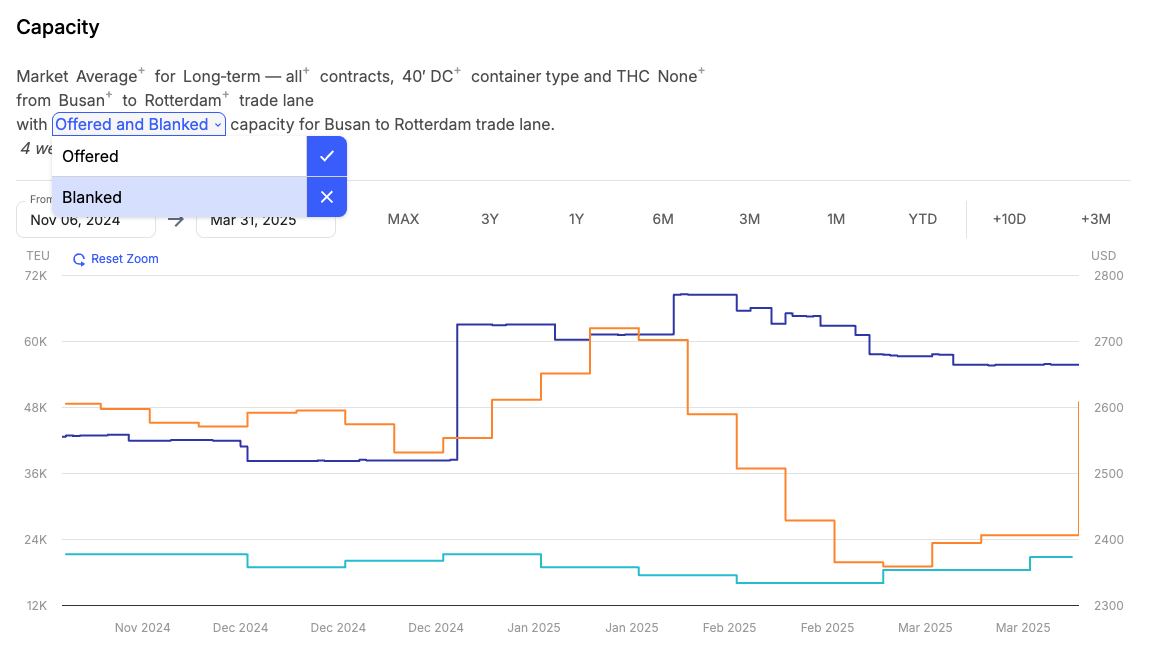
By default, the graph shows offered capacity data, but you can also add blanked capacity to view both datapoints alongside the market rates:
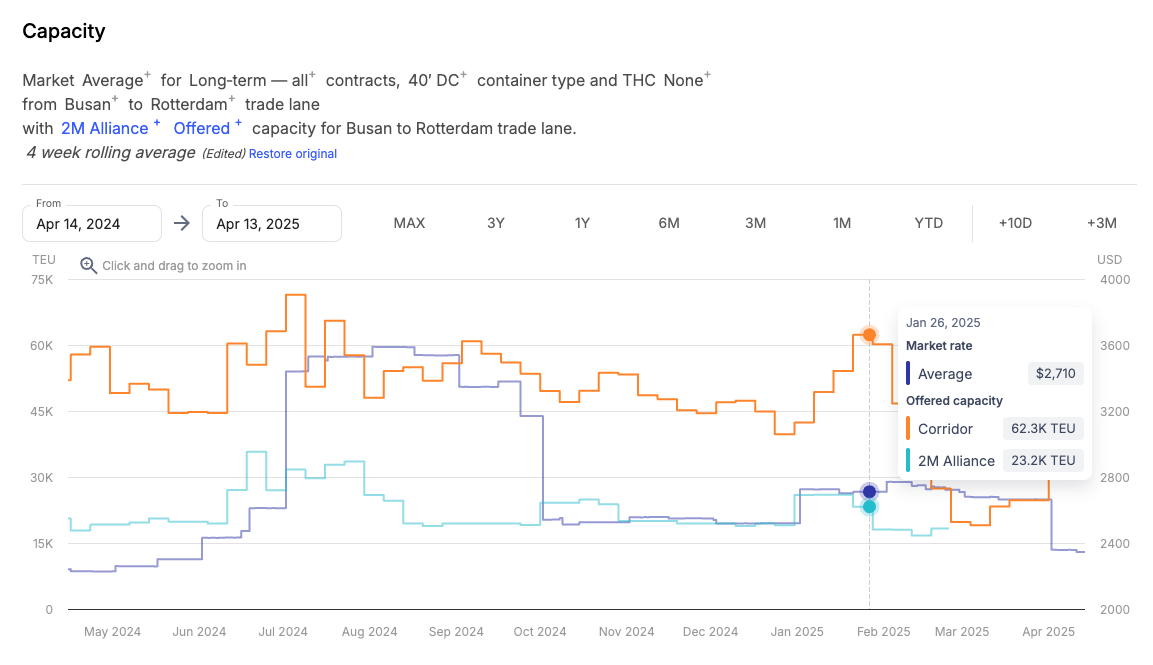
If you want to see capacity by carrier alliance, click on the Add comparison button to the right of the graph, and then go to Capacity > Alliance to select an alliance to review:
Capacity and Blanked Sailings can also be seen across multiple port-pairs together with other datasets in Market Trends.
When selecting an alliance you can only view either their offered or blanked capacity, but not both at the same time.
Capacity methodology
Offered capacity is calculated on proforma service schedules and average vessel capacity per service version, i.e. the original carrier-promised schedules.
Scheduled voyages may encounter the following exceptional events:
- Blanked sailings (entirely cancelled voyages)
- Omissions (skipped port calls)
- Inducements (unscheduled additional calls)
Blanked and skipped sailings are currently calculated as part of blanked capacity but omissions are not. New and improved additions to methodology will be implemented in Q1 2026.
Updated 15 days ago