How to use Benchmarks graph
This quick guide will walk you through our Benchmarks graph and briefly explain how you can explore the air market rate development and quickly see how rates on specific origin-destination pairs have been trending historically.
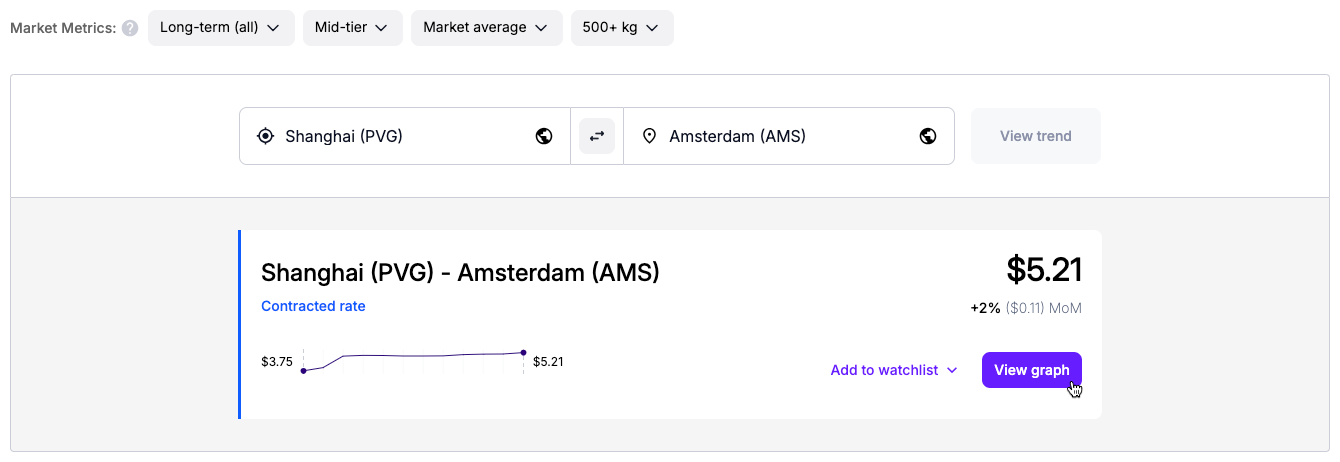
Step 1. Navigate to Market benchmarks
Go to Market overview and search for a trade lane that you want to explore historical rates on, then click on View trend to review the trade lane on Market benchmarks.
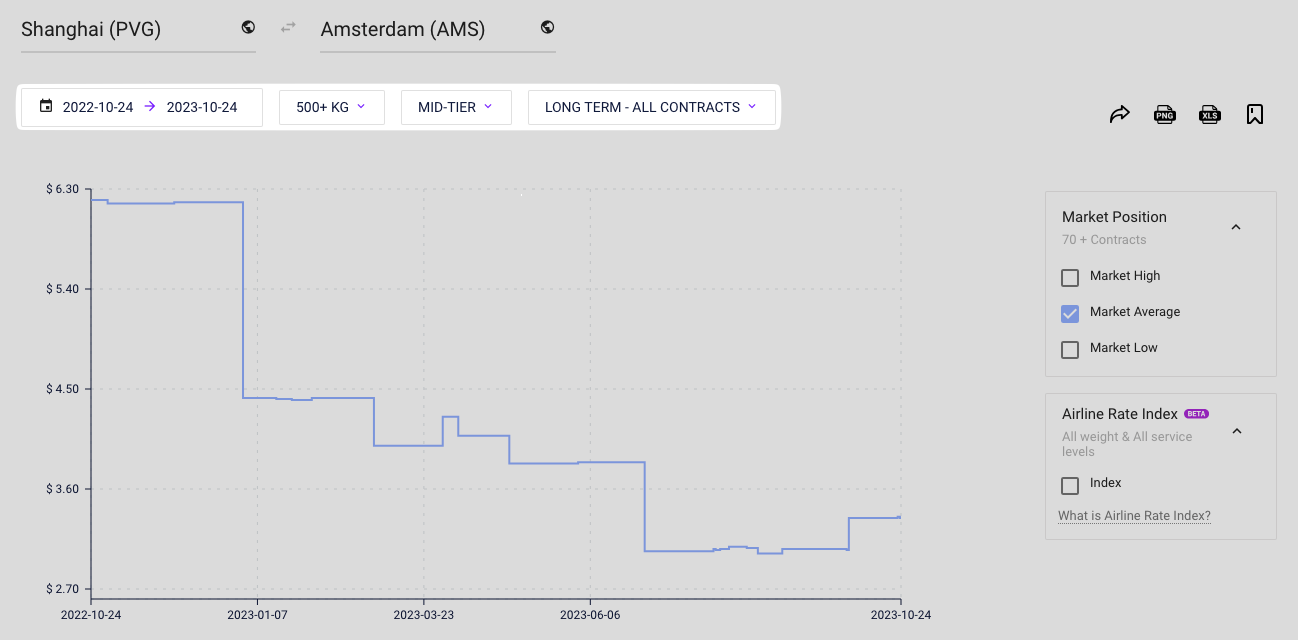
Step 2. Adjust parameters
Check and adjust the parameters for the rates displayed on the graph — pick a date range, weight category, service level, and contract type:
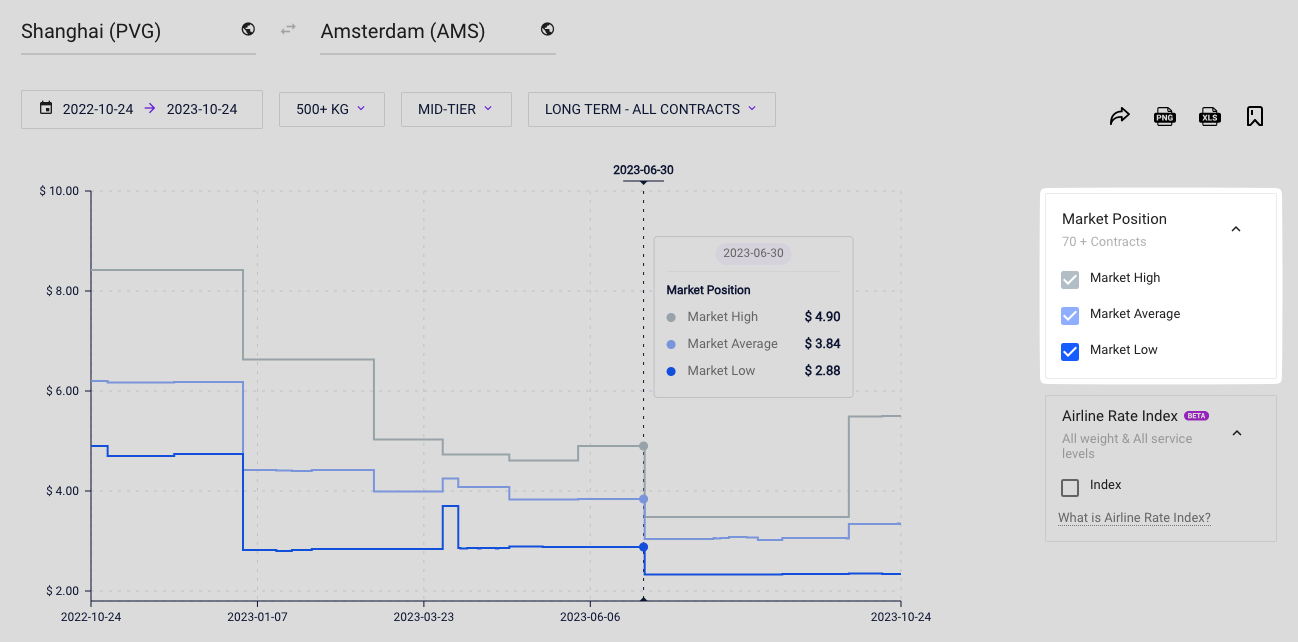
Step 3. Select market segments
Select the segments of the market that you want to review rates from:
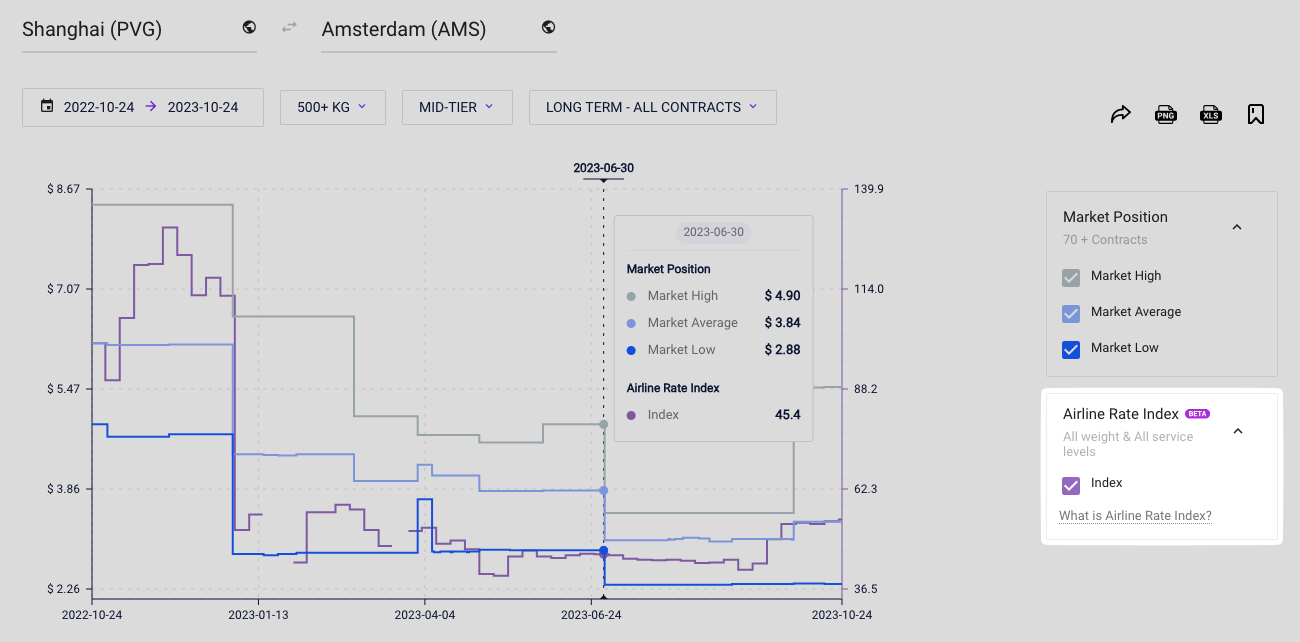
Step 4. Add airline rate index
Add airline rate index to the graph to review weekly development of rates between airlines and freight forwarders and see how they are trending compared to regular shipper rates:
Step 5. Add supplier rates
If you have uploaded your supplier rates to Xeneta, you can add them to the graph by checking the box next the the supplier's name in the table below the graph:
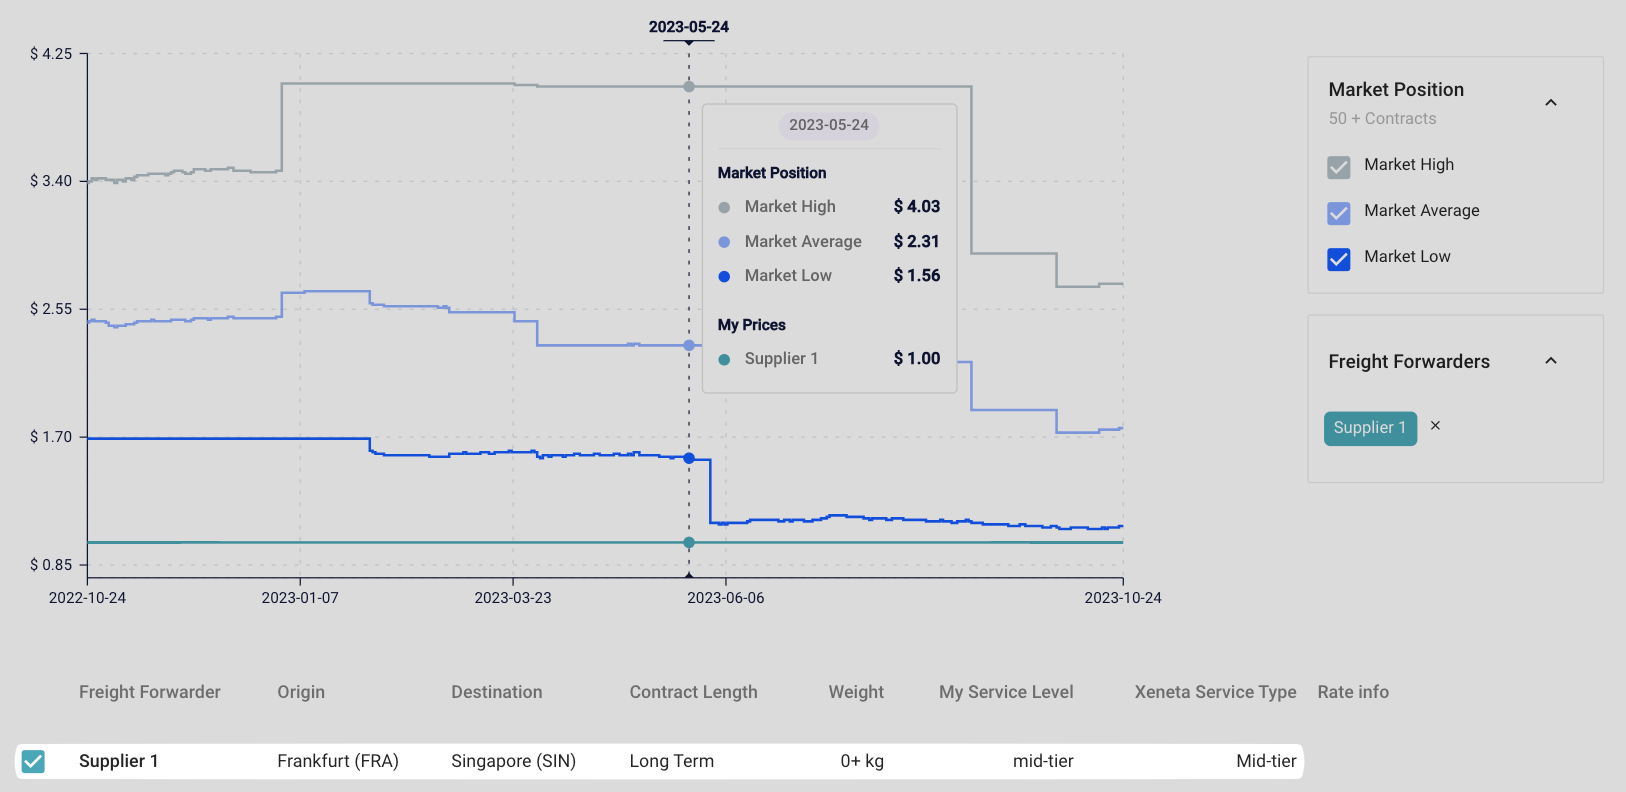
This will allow you to compare the rates offered to you by your freight forwarding partners to the average air freight market rates and see if you could potentially renegotiate a better deal.
Updated about 2 months ago